# cutecharts
**Repository Path**: JiaYunSong/cutecharts
## Basic Information
- **Project Name**: cutecharts
- **Description**: 📉 Hand drawing style charts library for Python
- **Primary Language**: Unknown
- **License**: MIT
- **Default Branch**: master
- **Homepage**: None
- **GVP Project**: No
## Statistics
- **Stars**: 2
- **Forks**: 1
- **Created**: 2021-03-15
- **Last Updated**: 2022-06-14
## Categories & Tags
**Categories**: Uncategorized
**Tags**: None
## README

📉 Hand drawing style charts library for Python.


## 📣 初衷
在闲逛 Github 的时候,发现了一个十分有趣的图表库 [chart.xkcd](https://github.com/timqian/chart.xkcd),该库的图表的手绘风格很可爱。所以有了一个将 chart.xkcd 和 Python 相结合的想法,这个想法最终变成了你现在所看到的 [cutecharts](https://github.com/chenjiandongx/cutecharts)。
chart.xkcd 的图表类型相对 Echarts 来说少得多,只支持几种基本的图表且没有太多的配置项,想使用更丰富的图表的话 [pyecharts](https://github.com/pyecharts/pyecharts) 或许是个更好的选择。cutecharts 我个人的想法是作为一个学习如何将 Javascript 与 Python/Notebook 相结合的项目。毋庸置疑,JS 库在交互性以及动画效果上有天然的优势,若能够将其优势与 Notebook 环境结合起来的话,那将能够产生很多有趣的项目。
cutecharts 的项目结构与 pyecharts 基本保持一致,拥有 pyecharts 的所有核心功能。但是整体更加小巧,代码更加精简。如果把 cutecharts 代码读完了,再去看 pyecharts 的代码,可能就会发现,其实也就那样,根本就没什么神秘的东西。在这里也是抛砖引玉,希望 Python 社区有更多地将 JS 与 Python/Notebook 结合的优秀第三方库。**cutecharts 的学习价值远大于它的使用价值。**
## 🔰 安装
**pip 安装**
```shell
$ pip(3) install cutecharts
```
**源码安装**
```shell
$ git clone https://github.com/chenjiandongx/cutecharts.git
$ cd cutecharts
$ pip install -r requirements.txt
$ python setup.py install
```
## 📝 使用
* 图表文档:[docs/charts.md](./docs/charts.md)
* 组件文档:[docs/components.md](./docs/components.md)
* 版本日志:[docs/changelog.md](./docs/changelog.md)
### 本地环境
#### 生成 HTML
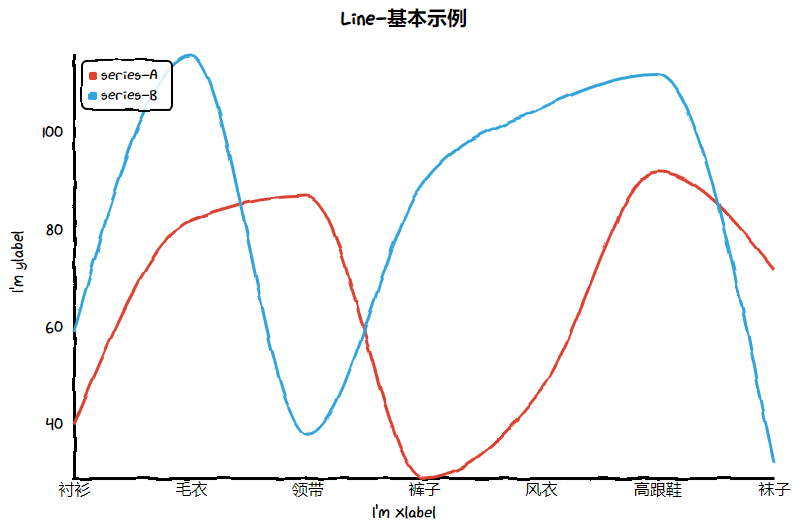
```python
from cutecharts.charts import Line
chart = Line("某商场销售情况")
chart.set_options(
labels=["衬衫", "毛衣", "领带", "裤子", "风衣", "高跟鞋", "袜子"],
x_label="I'm xlabel",
y_label="I'm ylabel",
)
chart.add_series("series-A", [57, 134, 137, 129, 145, 60, 49])
chart.add_series("series-B", [114, 55, 27, 101, 125, 27, 105])
chart.render()
```
`render` 方法会在本地生成一个 render.html 文件,使用浏览器打开。

### Notebook 环境
#### Jupyter Notebook

#### JupyterLab
使用 JupyterLab 需要注意
```python
# 1. 在顶部引入声明
from cutecharts.globals import use_jupyter_lab; use_jupyter_lab()
# 2. 在 Notebook 中第一次使用图表时,先调用一次 `load_javascript`,仅需一次。
chart.load_javascript()
```

## 🔖 Demo
> Demo 代码位于 examples 文件夹下。
## ⛏ 代码质量
### 单元测试
```shell
$ pip install -r tests/requirements.txt
$ test
```
### 集成测试
使用 [Travis CI](https://travis-ci.org/) 和 [AppVeyor](https://ci.appveyor.com/) 持续集成环境。
### 代码规范
使用 [flake8](http://flake8.pycqa.org/en/latest/index.html), [Codecov](https://codecov.io/) 以及 [pylint](https://www.pylint.org/) 提升代码质量。
## 📃 License
MIT [©chenjiandongx](https://github.com/chenjiandongx)