# pathfind
**Repository Path**: MorvanZhou/pathfind
## Basic Information
- **Project Name**: pathfind
- **Description**: 寻路算法,python 实现
- **Primary Language**: Unknown
- **License**: MIT
- **Default Branch**: main
- **Homepage**: None
- **GVP Project**: No
## Statistics
- **Stars**: 2
- **Forks**: 0
- **Created**: 2022-11-10
- **Last Updated**: 2024-01-30
## Categories & Tags
**Categories**: Uncategorized
**Tags**: None
## README
# PathFind
Implementation of path finding algorithms including:
- Depth-First Search (DFS)
- Breadth-First Search (BFS)
- Dijkstra Search
- Greedy Best-First Search
- A\*
- D\*-Lite
- Jump Point Search (JPS)
# Install
```shell
pip install pathfind
```
# Basic Usage
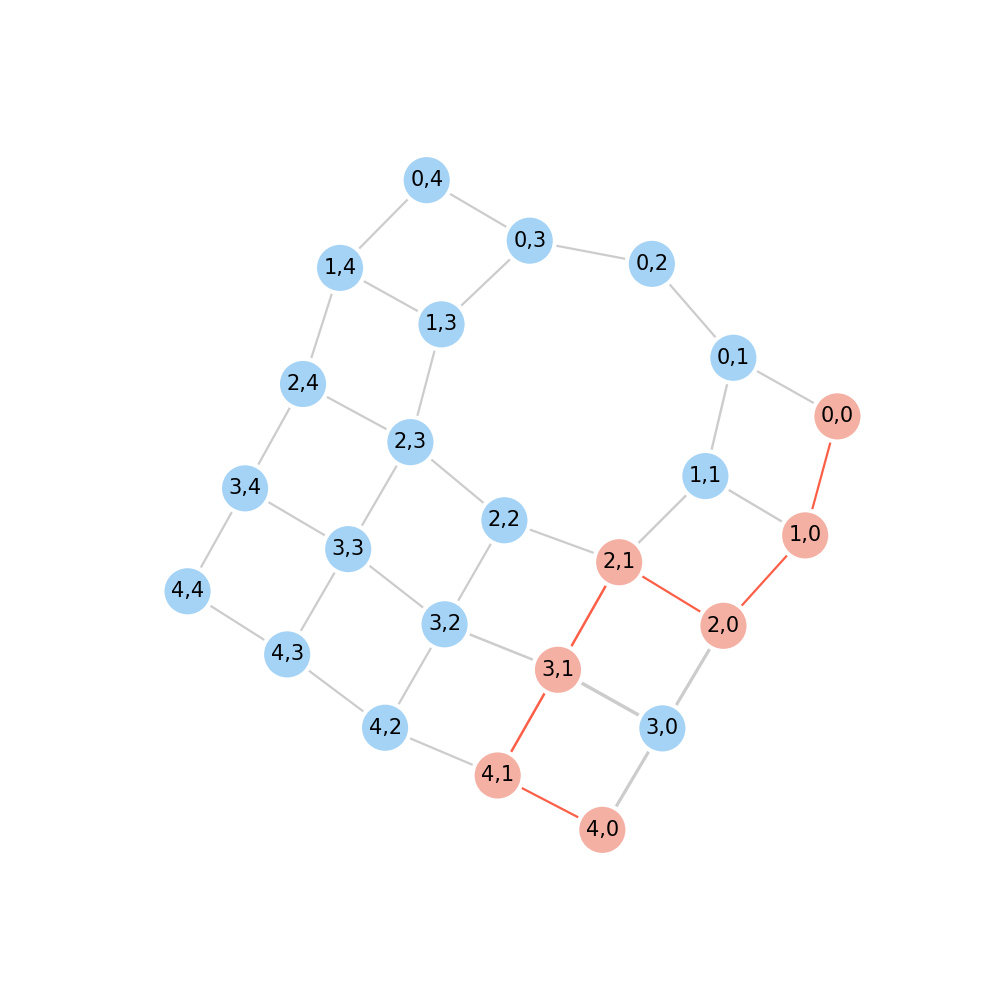
Define a graph to transform graph from a matrix, then find a path from start point to end point. The value in `m`
indicates a cost at that node. Note that the -1 in `m` represents the cost in that node is infinity, which means this
node is not connected to others.
```python
import pathfind
m = [
[1, 1, 1, 1, 1],
[1, 2, -1, 1, 1],
[1, 1, 1, 1, 1],
[8, 3, 1, 1, 1],
[1, 1, 1, 1, 1],
]
graph = pathfind.transform.matrix2graph(m)
path = pathfind.find(graph, start="4,0", end="0,0")
# ['4,0', '4,1', '3,1', '2,1', '2,0', '1,0', '0,0']
graph.show(trace=path)
```
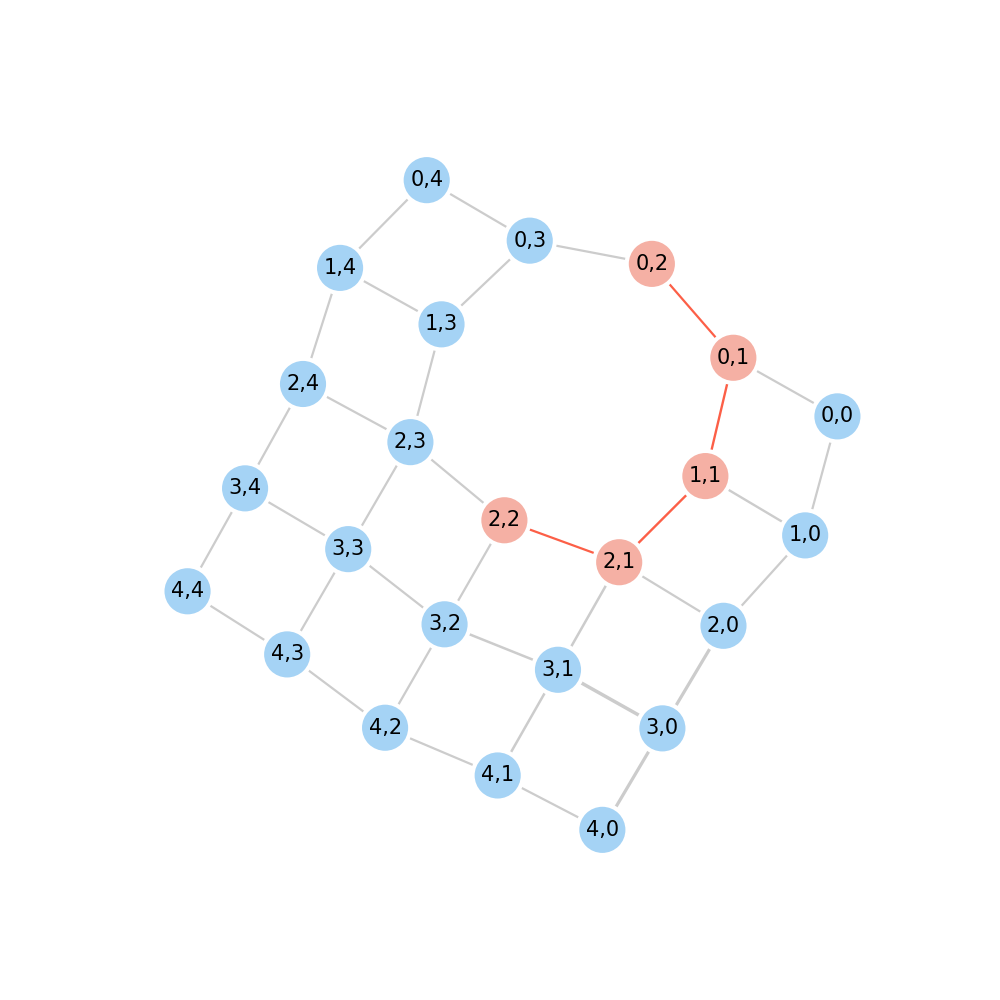
 Finder can be changed by passing a string method ("a*", "bfs", "greedy", "dijkstra", "dfs", "d*lite", "jps").
```python
path = pathfind.find(graph, start="2,2", end="0,2", method="bfs")
# ['2,2', '2,1', '1,1', '0,1', '0,2']
graph.show(trace=path)
```
Finder can be changed by passing a string method ("a*", "bfs", "greedy", "dijkstra", "dfs", "d*lite", "jps").
```python
path = pathfind.find(graph, start="2,2", end="0,2", method="bfs")
# ['2,2', '2,1', '1,1', '0,1', '0,2']
graph.show(trace=path)
```
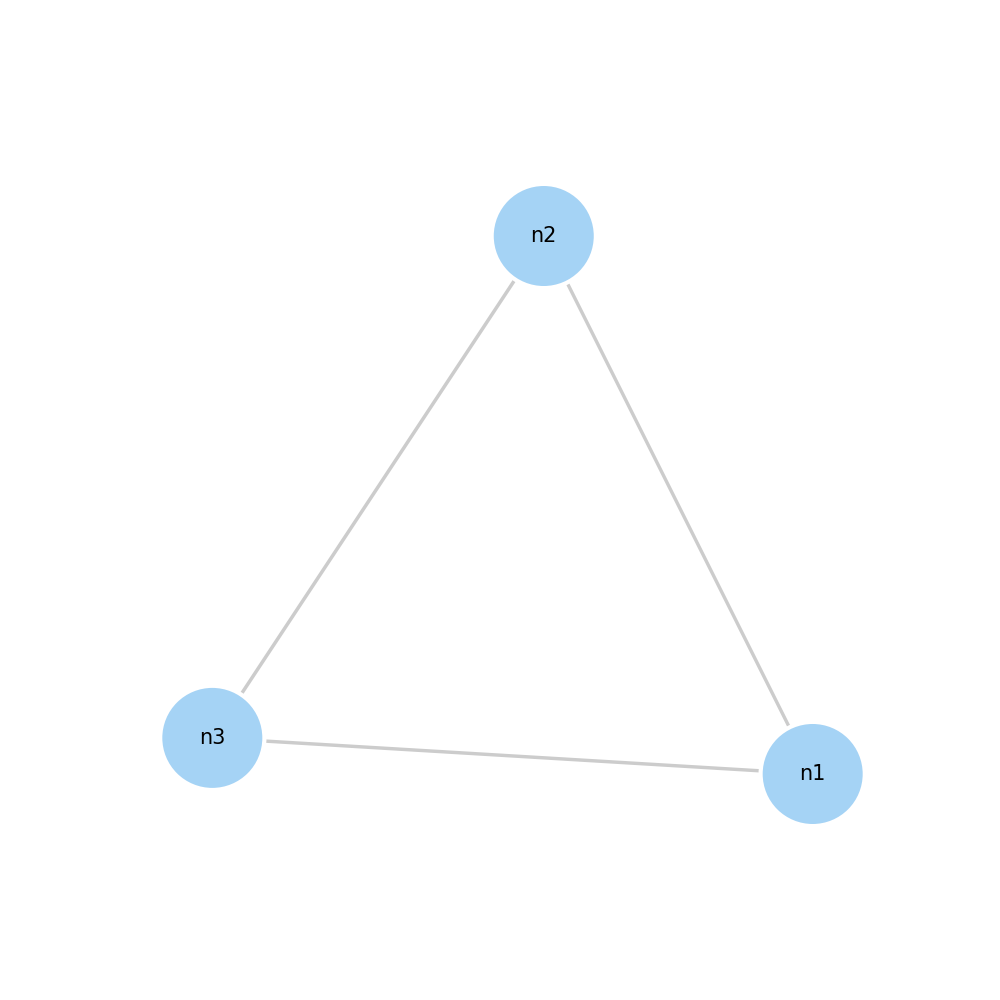
 # Graph setup
Another way to define a graph is to config the edge by give \[node1's name, node2's name, cost] pairs.
```python
import pathfind
conf = [
# [node1's name, node2's name, weight, *back_weight]
["n1", "n2", 0.1],
["n1", "n3", 0.2],
["n2", "n3", 0.3]
]
graph = pathfind.Graph(conf)
graph.show()
```
# Graph setup
Another way to define a graph is to config the edge by give \[node1's name, node2's name, cost] pairs.
```python
import pathfind
conf = [
# [node1's name, node2's name, weight, *back_weight]
["n1", "n2", 0.1],
["n1", "n3", 0.2],
["n2", "n3", 0.3]
]
graph = pathfind.Graph(conf)
graph.show()
```
 Or you can set edge's and node's details by following way:
```python
import pathfind
my_n0 = pathfind.Node(name="my_n0") # node name set to "my_n0"
auto_name = pathfind.Node() # node name automatically set to "n0"
n2 = "n2" # pass a string to represent node name
e0 = pathfind.Edge(node1=my_n0, node2=auto_name, weight=0.2)
e1 = pathfind.Edge(node1=my_n0, node2=n2, weight=0.1)
e2 = pathfind.Edge(auto_name, n2, weight=0)
g = pathfind.Graph()
g.add_edges([e0, e1, e2])
g.show()
g.edges
"""
{'my_n0:n0': my_n0:n0, 'my_n0:n2': my_n0:n2, 'n0:n2': n0:n2}
"""
```
Or you can set edge's and node's details by following way:
```python
import pathfind
my_n0 = pathfind.Node(name="my_n0") # node name set to "my_n0"
auto_name = pathfind.Node() # node name automatically set to "n0"
n2 = "n2" # pass a string to represent node name
e0 = pathfind.Edge(node1=my_n0, node2=auto_name, weight=0.2)
e1 = pathfind.Edge(node1=my_n0, node2=n2, weight=0.1)
e2 = pathfind.Edge(auto_name, n2, weight=0)
g = pathfind.Graph()
g.add_edges([e0, e1, e2])
g.show()
g.edges
"""
{'my_n0:n0': my_n0:n0, 'my_n0:n2': my_n0:n2, 'n0:n2': n0:n2}
"""
```
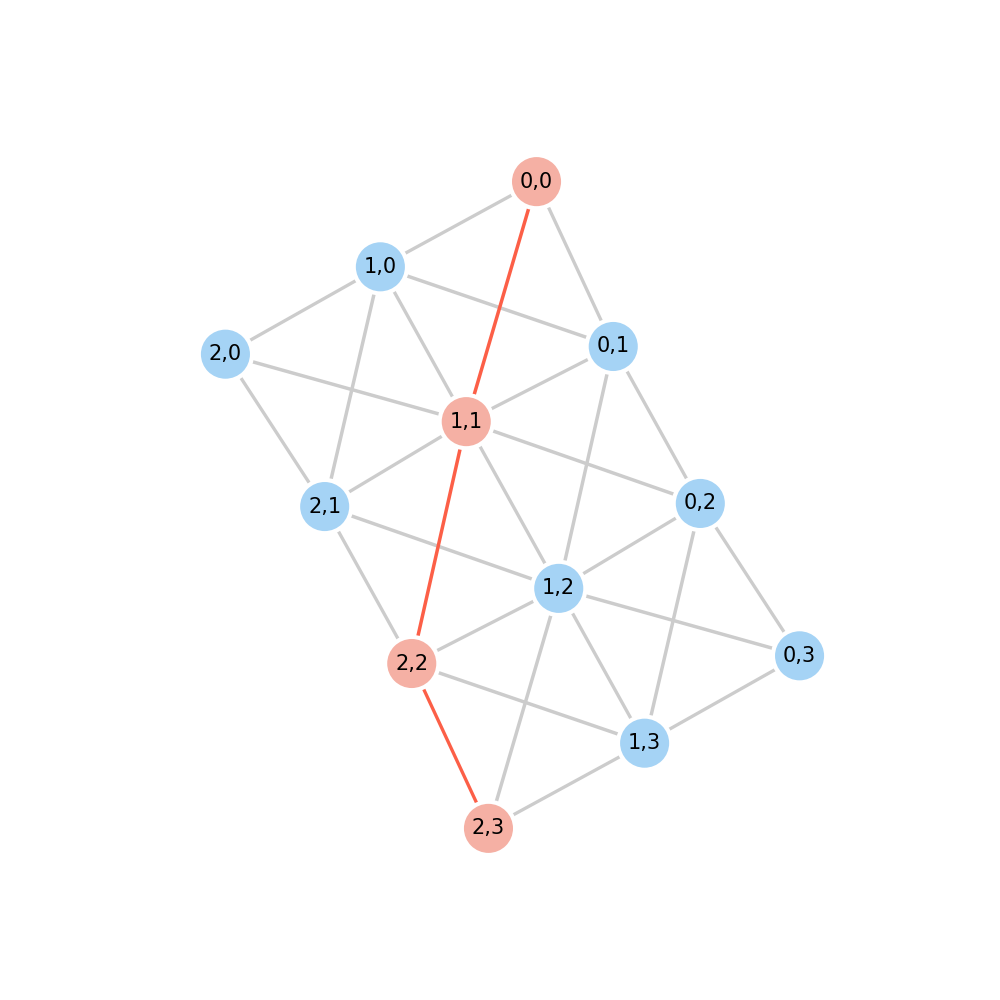
 A diagonal grid graph can be generated by following way:
```python
import pathfind
m = [
[1, 1, 1, 1],
[1, 1, 1, 1],
[1, 1, 1, 1],
]
graph = pathfind.transform.matrix2graph(m, diagonal=True)
path = pathfind.find(graph, start="0,0", end="2,3")
# ['0,0', '1,1', '2,2', '2,3']
graph.show(trace=path)
```
A diagonal grid graph can be generated by following way:
```python
import pathfind
m = [
[1, 1, 1, 1],
[1, 1, 1, 1],
[1, 1, 1, 1],
]
graph = pathfind.transform.matrix2graph(m, diagonal=True)
path = pathfind.find(graph, start="0,0", end="2,3")
# ['0,0', '1,1', '2,2', '2,3']
graph.show(trace=path)
```
 # More examples
More examples and usages can be found in [test](/tests)
# More examples
More examples and usages can be found in [test](/tests)