# grafanaflowchart
**Repository Path**: SRIM/grafanaflowchart
## Basic Information
- **Project Name**: grafanaflowchart
- **Description**: No description available
- **Primary Language**: Unknown
- **License**: Apache-2.0
- **Default Branch**: main
- **Homepage**: None
- **GVP Project**: No
## Statistics
- **Stars**: 0
- **Forks**: 0
- **Created**: 2026-06-15
- **Last Updated**: 2026-06-15
## Categories & Tags
**Categories**: Uncategorized
**Tags**: None
## README
# Grafana Flowcharting Panel Plugin
A Grafana panel plugin for rendering Draw.io/mxGraph diagrams with data-driven visualization. Map your metrics to diagram elements — change colors, text, links, and animations based on real-time data thresholds.
[](https://grafana.com)
[](https://github.com/manojrammurthy/grafanaflowchart/blob/main/LICENSE)
[](https://grafana.com/grafana/plugins/)
## Features
- **Draw.io Integration** — Paste any Draw.io XML diagram (raw, compressed, or multi-page)
- **Threshold-Based Coloring** — Cells change fill, stroke, or font color based on OK/Warning/Critical thresholds
- **Gradient Thresholds** — Smooth RGB color interpolation across configurable ranges
- **Text Replacement** — Replace cell labels with live metric values using regex templates
- **Clickable Links** — Make cells navigate to other dashboards or external URLs
- **Tooltips with Sparklines** — Hover to see metric name, value, threshold level, timestamp, and mini trend graph
- **Animations** — Blink or fade cells on alert conditions
- **Floorplan Shapes** — Built-in support for Draw.io floorplan shapes (doors, walls, etc.)
- **Multi-Flowchart Tabs** — Switch between multiple diagrams in a single panel
- **Draw.io Editor** — In-panel diagram editor via iframe integration
## Screenshots
### House Plan Temperature Monitor
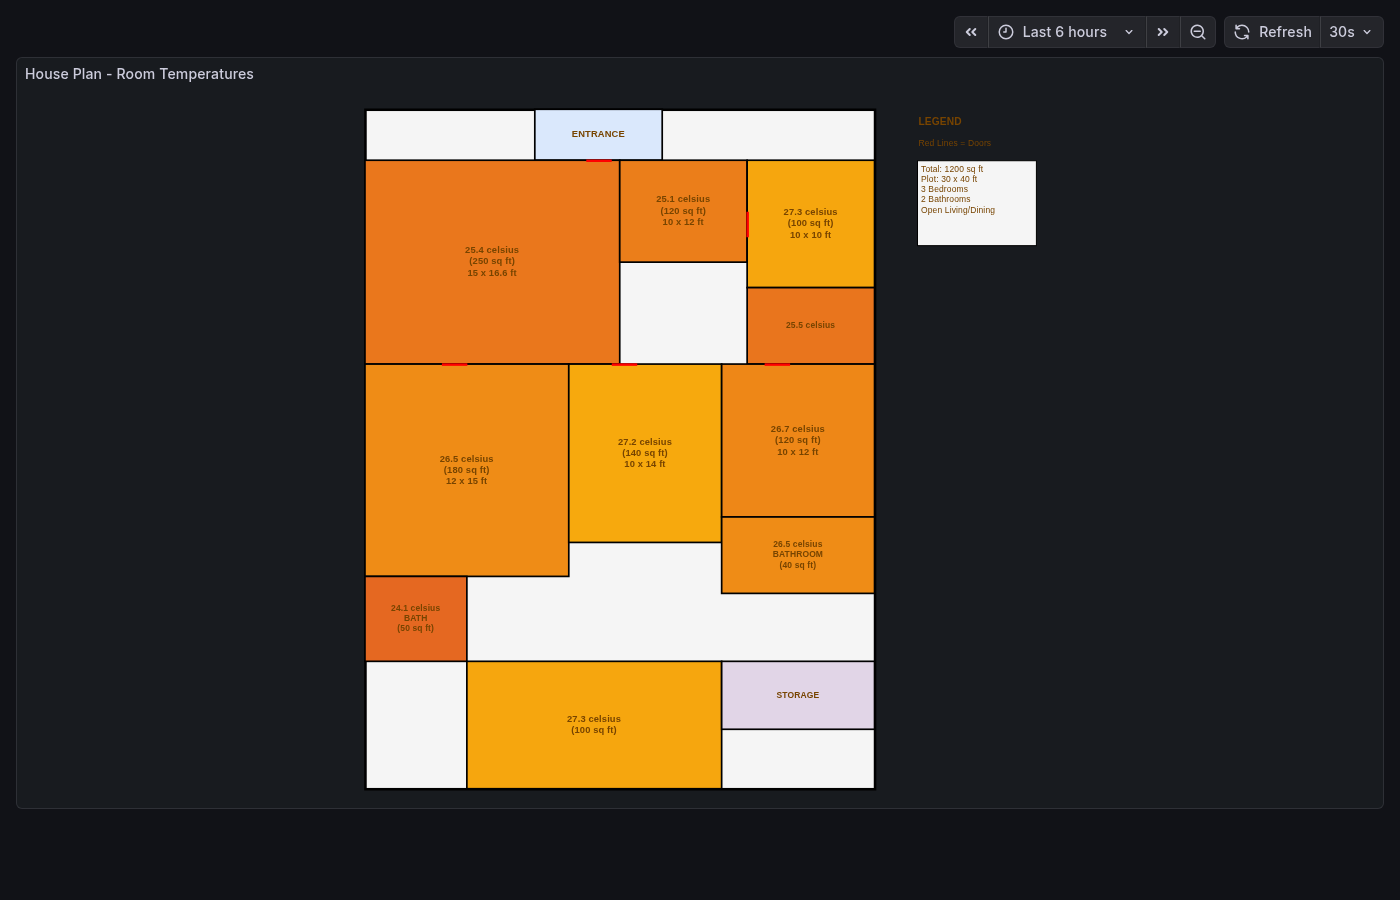
1200 sq ft house plan with 10 temperature sensors mapped to rooms via CSV datasource.
### Tooltip with Sparkline Graph
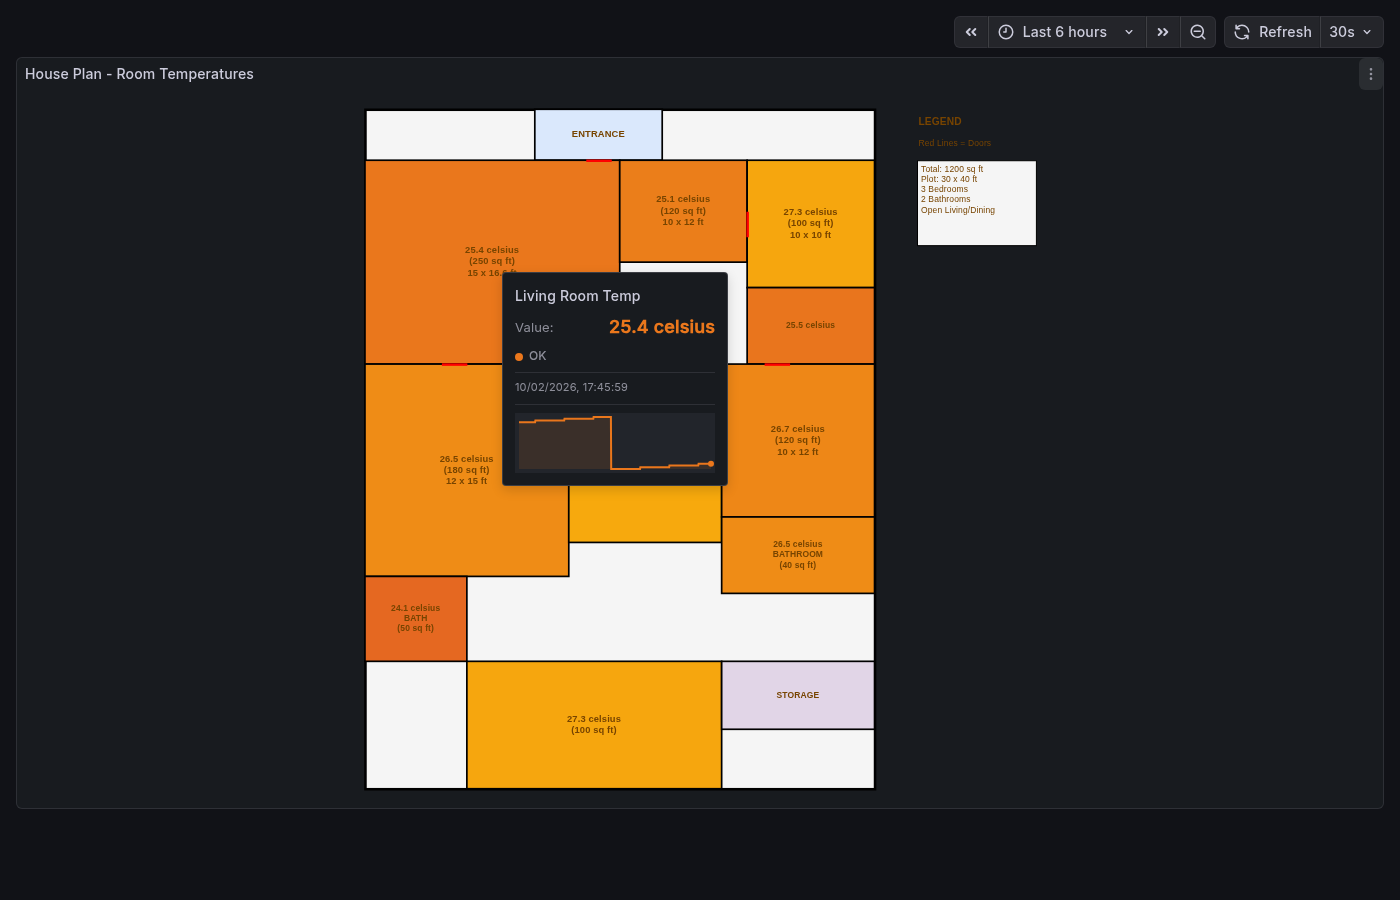
Hover tooltip showing metric name, formatted value, threshold status, timestamp, and temperature trend sparkline.
## Installation
### From Grafana Plugin Catalog
Search for **"Flowcharting"** in the Grafana plugin catalog and click Install.
### From Source
```bash
git clone https://github.com/manojrammurthy/grafanaflowchart.git
cd flowcharting-panel
npm install --legacy-peer-deps
npm run build
```
Copy the built plugin to Grafana:
```bash
sudo mkdir -p /var/lib/grafana/plugins/manojflowcharting-flowcharting-panel
sudo cp -r dist/* /var/lib/grafana/plugins/manojflowcharting-flowcharting-panel/
sudo chown -R grafana:grafana /var/lib/grafana/plugins/manojflowcharting-flowcharting-panel/
sudo systemctl restart grafana-server
```
For unsigned development builds, add to `grafana.ini`:
```ini
[plugins]
allow_loading_unsigned_plugins = manojflowcharting-flowcharting-panel
```
## Quick Start
1. **Create a diagram** at [app.diagrams.net](https://app.diagrams.net)
2. **Export as XML** (File -> Export as -> XML)
3. **Create a Grafana panel** using the Flowcharting type
4. **Paste your XML** in the Flowchart Source -> Content field
5. **Add rules** to map metrics to diagram cells
6. **Set thresholds** to define color ranges
See [SETUP-GUIDE.md](https://github.com/manojrammurthy/grafanaflowchart/blob/main/SETUP-GUIDE.md) for the complete configuration reference.
## Rule Configuration
### Shape Maps
Map metric thresholds to cell visual properties:
- **fillColor** — Background color of the shape
- **strokeColor** — Border/outline color
- **fontColor** — Text color
### Text Maps
Replace cell text with metric values using templates:
- `/.*/` — Replace all text with formatted value
- `${_formattedValue}` — Formatted value with unit
- `Temp: ${_formattedValue}` — Custom prefix
### Link Maps
Make cells clickable:
- Grafana dashboards: `/d/dashboard-uid/dashboard-name`
- External URLs: `https://example.com/details`
- With variables: `/d/details?var-room=${_ruleName}`
### Gradient Thresholds
Define an array of threshold values and colors for smooth interpolation between temperature ranges:
```json
"gradientThresholds": [24, 25, 26, 27, 28, 29, 30, 31, 32, 33, 34],
"gradientColors": ["#418AB3", "#669591", "#8CA06E", "#b2ac4c", "#fec306", "#f8ad0c", "#f29713", "#ec8019", "#e66a20", "#DF5327"]
```
## Supported Diagram Formats
- Raw Draw.io XML (`...`)
- Draw.io compressed format (base64 + deflateRaw + URL-encoded)
- Multi-page mxfile wrapper (`...`)
- SVG content
## Architecture
```
Data Flow:
DataFrame[] -> MetricProcessor -> RuleEvaluator -> StateComputer -> StateCycleApplier -> mxGraph DOM
Source Structure:
src/
├── module.tsx # Plugin entry point
├── types/ # TypeScript interfaces and constants
├── core/ # Pure data processing (no React)
│ ├── MetricProcessor.ts # DataFrame -> processed metrics
│ ├── RuleEvaluator.ts # Rules + metrics -> evaluated results
│ ├── ThresholdEvaluator.ts # Value + thresholds -> level/color
│ ├── StateComputer.ts # Rule results -> cell states
│ └── StateCycleApplier.ts # Apply states to mxGraph cells
├── graph/ # mxGraph wrapper layer
├── hooks/ # React hooks (useGraph, useTooltip, useZoom, etc.)
├── components/ # React components (Panel, Renderer, Tooltip)
├── editors/ # Panel option editors (Rules, ShapeMaps, etc.)
└── utils/ # Utilities (compression, patterns, formatting)
```
## Compatibility
- Grafana 10.x, 11.x, 12.x
- React-based panel (replaces the deprecated Angular version)
## Dependencies
- [mxGraph](https://github.com/jgraph/mxgraph) — Diagram rendering engine
- [pako](https://github.com/nodeca/pako) — Compression for Draw.io format
- Grafana SDK (@grafana/data, @grafana/ui, @grafana/runtime)
## Contributing
1. Fork the repository
2. Create a feature branch (`git checkout -b feature/my-feature`)
3. Commit your changes (`git commit -am 'Add my feature'`)
4. Push to the branch (`git push origin feature/my-feature`)
5. Open a Pull Request
## Developer
**Manoj Rammurthy** (manoj-Flowcharting)
- GitHub: [https://github.com/manojrammurthy](https://github.com/manojrammurthy)
## License
[Apache License 2.0](https://github.com/manojrammurthy/grafanaflowchart/blob/main/LICENSE)
## Acknowledgments
- Inspired by [algenty/grafana-flowcharting](https://github.com/algenty/grafana-flowcharting) (original Angular plugin by Arnaud Genty)
- [Draw.io / diagrams.net](https://www.diagrams.net/) for the diagram editor and shape libraries
- [mxGraph](https://github.com/jgraph/mxgraph) by JGraph for the rendering engine