# Price-Forcast-with-Facebook-Prophet
**Repository Path**: agedcoder/Price-Forcast-with-Facebook-Prophet
## Basic Information
- **Project Name**: Price-Forcast-with-Facebook-Prophet
- **Description**: Prophet is a procedure for forecasting time series data based on an additive model where non-linear trends are fit with yearly, weekly, and daily seasonality, plus holiday effects.
- **Primary Language**: Unknown
- **License**: MIT
- **Default Branch**: master
- **Homepage**: None
- **GVP Project**: No
## Statistics
- **Stars**: 0
- **Forks**: 0
- **Created**: 2022-01-14
- **Last Updated**: 2022-01-14
## Categories & Tags
**Categories**: Uncategorized
**Tags**: None
## README
# Price-Forcast-with-Facebook-Prophet📈
Prophet is an open source library published by Facebook that is based on decomposable (trend+seasonality+holidays) models. It provides us with the ability to make time series predictions with good accuracy using simple intuitive parameters and has support for including impact of custom seasonality and holidays
 ## The Prophet Forecasting Model
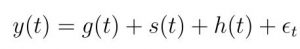
We use a decomposable time series model with three main model components: trend, seasonality, and holidays. They are combined in the following equation:
## The Prophet Forecasting Model
We use a decomposable time series model with three main model components: trend, seasonality, and holidays. They are combined in the following equation:
g(t): piecewise linear or logistic growth curve for modelling non-periodic changes in time series
s(t): periodic changes (e.g. weekly/yearly seasonality)
h(t): effects of holidays (user provided) with irregular schedules
εt: error term accounts for any unusual changes not accommodated by the model
Using time as a regressor, Prophet is trying to fit several linear and non linear functions of time as components. Modeling seasonality as an additive component is the same approach taken by exponential smoothing in Holt-Winters technique . We are, in effect, framing the forecasting problem as a curve-fitting exercise rather than looking explicitly at the time based dependence of each observation within a time series.
## Trend
Trend is modelled by fitting a piece wise linear curve over the trend or the non-periodic part of the time series. The linear fitting exercise ensures that it is least affected by spikes/missing data.
### Saturating growth
An important question to ask here is – Do we expect the target to keep growing/falling for the entire forecast interval?
More often than not, there are cases with non-linear growth with a running maximum capacity. I will illustrate this with an example below.
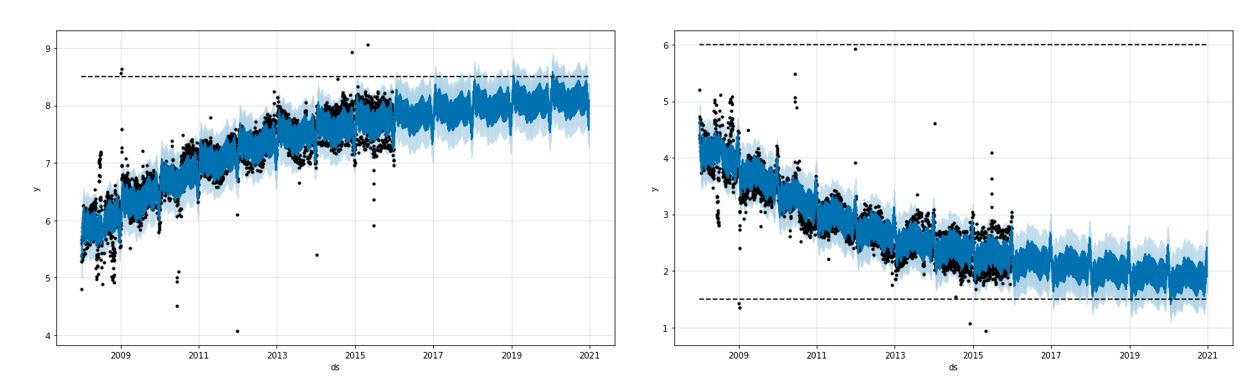
Let’s say we are trying to forecast number of downloads of an app in a region for the next 12 months. The maximum downloads is always capped by the total number of smartphone users in the region. The number of smartphone users will also, however, increase with time.
With domain knowledge at his/her disposal, an analyst can then define a varying capacity C(t) for the time series forecasts he/she is trying to make.
### Changepoints
Another question to answer is whether my time series encounters any underlying changes in the phenomena e.g. a new product launch, unforeseen calamity etc. At such points, the growth rate is allowed to change. These changepoints are automatically selected. However, a user can also feed the changepoints manually if it is required. In the below plot, the dotted lines represent the changepoints for the given time series.
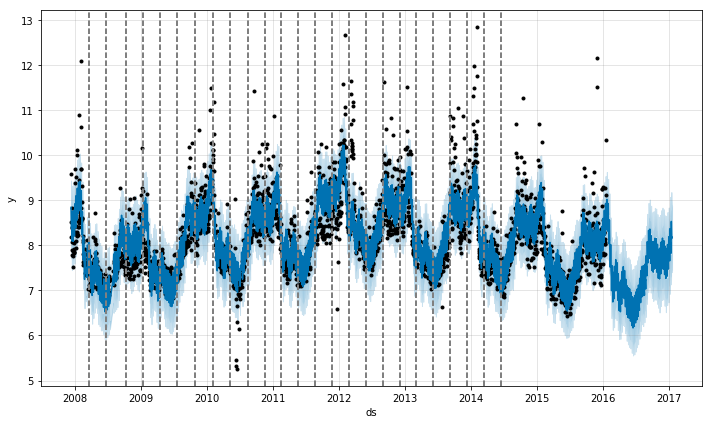
As the number of changepoints allowed is increased the fit becomes more flexible. There are basically 2 problems an analyst might face while working with the trend component:
Overfitting
Underfitting
A parameter called changepoint_prior_scale could be used to adjust the trend flexibility and tackle the above 2 problems. Higher value will fit a more flexible curve to the time series.
### Seasonality
To fit and forecast the effects of seasonality, prophet relies on fourier series to provide a flexible model. Seasonal effects s(t) are approximated by the following function:
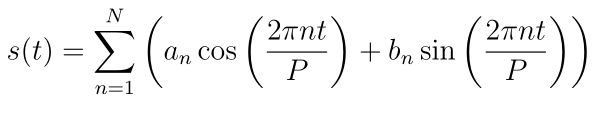
P is the period (365.25 for yearly data and 7 for weekly data)
Parameters [a1, b1, ….., aN, bN] need to be estimated for a given N to model seasonality.
The fourier order N that defines whether high frequency changes are allowed to be modelled is an important parameter to set here. For a time series, if the user believes the high frequency components are just noise and should not be considered for modelling, he/she could set the values of N from to a lower value. If not, N can be tuned to a higher value and set using the forecast accuracy.
### Holidays and events
Holidays and events incur predictable shocks to a time series. For instance, Diwali in India occurs on a different day each year and a large portion of the population buy a lot of new items during this period.
Prophet allows the analyst to provide a custom list of past and future events. A window around such days are considered separately and additional parameters are fitted to model the effect of holidays and events.
# Prophet in action (using Python💕)
First you have to install Prophent to your local enviroment link
```
pip install fbprophet
```
#### Note: you may incounter issue with this command the follow the following steps (with reference to link) :
1. On Prompt install Ephem:
```
conda install -c anaconda ephem
```
2. Install Pystan:
```
conda install -c conda-forge pystan
```
3. Finally install Fbprophet
```
conda install -c conda-forge fbprophet
```
Prophet() function is used do define a Prophet forecasting model in Python. Let us look at the most important parameters:
### Trend parameters
| Parameter | Description |
| --------- | ----------- |
| growth | linear’ or ‘logistic’ to specify a linear or logistic trend |
| changepoints | List of dates at which to include potential changepoints (automatic if not specified) |
| n_changepoints | If changepoints in not supplied, you may provide the number of changepoints to be automatically included |
| changepoint_prior_scale | Parameter for changing flexibility of automatic changepoint selection |
### Seasonality & Holiday Parameters
| Parameter | Description |
| --------- | ----------- |
| yearly_seasonality | Fit yearly seasonality |
| weekly_seasonality | Fit weekly seasonality |
| daily_seasonality | Fit daily seasonality |
| holidays | Feed dataframe containing holiday name and date |
| seasonality_prior_scale | Parameter for changing strength of seasonality model |
| holiday_prior_scale | Parameter for changing strength of holiday model |
yearly_seasonality, weekly_seasonality & daily_seasonality can take values as True, False and no of fourier terms which was discussed in the last section. If the value is True, default number of fourier terms (10) are taken. Prior scales are defined to tell the model how strongly it needs to consider the seasonal/holiday components while fitting and forecasting.
## Developed and Maintained by
Debanshu777😎
## License
This project is licensed under the MIT License - see the LICENSE.md file for details
#### Thank you 😊