1 Star 0 Fork 0

ahzg/vue-tree-chart

加入 Gitee
与超过 1200万 开发者一起发现、参与优秀开源项目,私有仓库也完全免费 :)
免费加入
该仓库未声明开源许可证文件(LICENSE),使用请关注具体项目描述及其代码上游依赖。
克隆/下载
贡献代码
同步代码
取消
提示: 由于 Git 不支持空文件夾,创建文件夹后会生成空的 .keep 文件
Loading...
README

English | 中文

Demo 页面

https://ssthouse.github.io/vue-tree-chart/#/svgTree

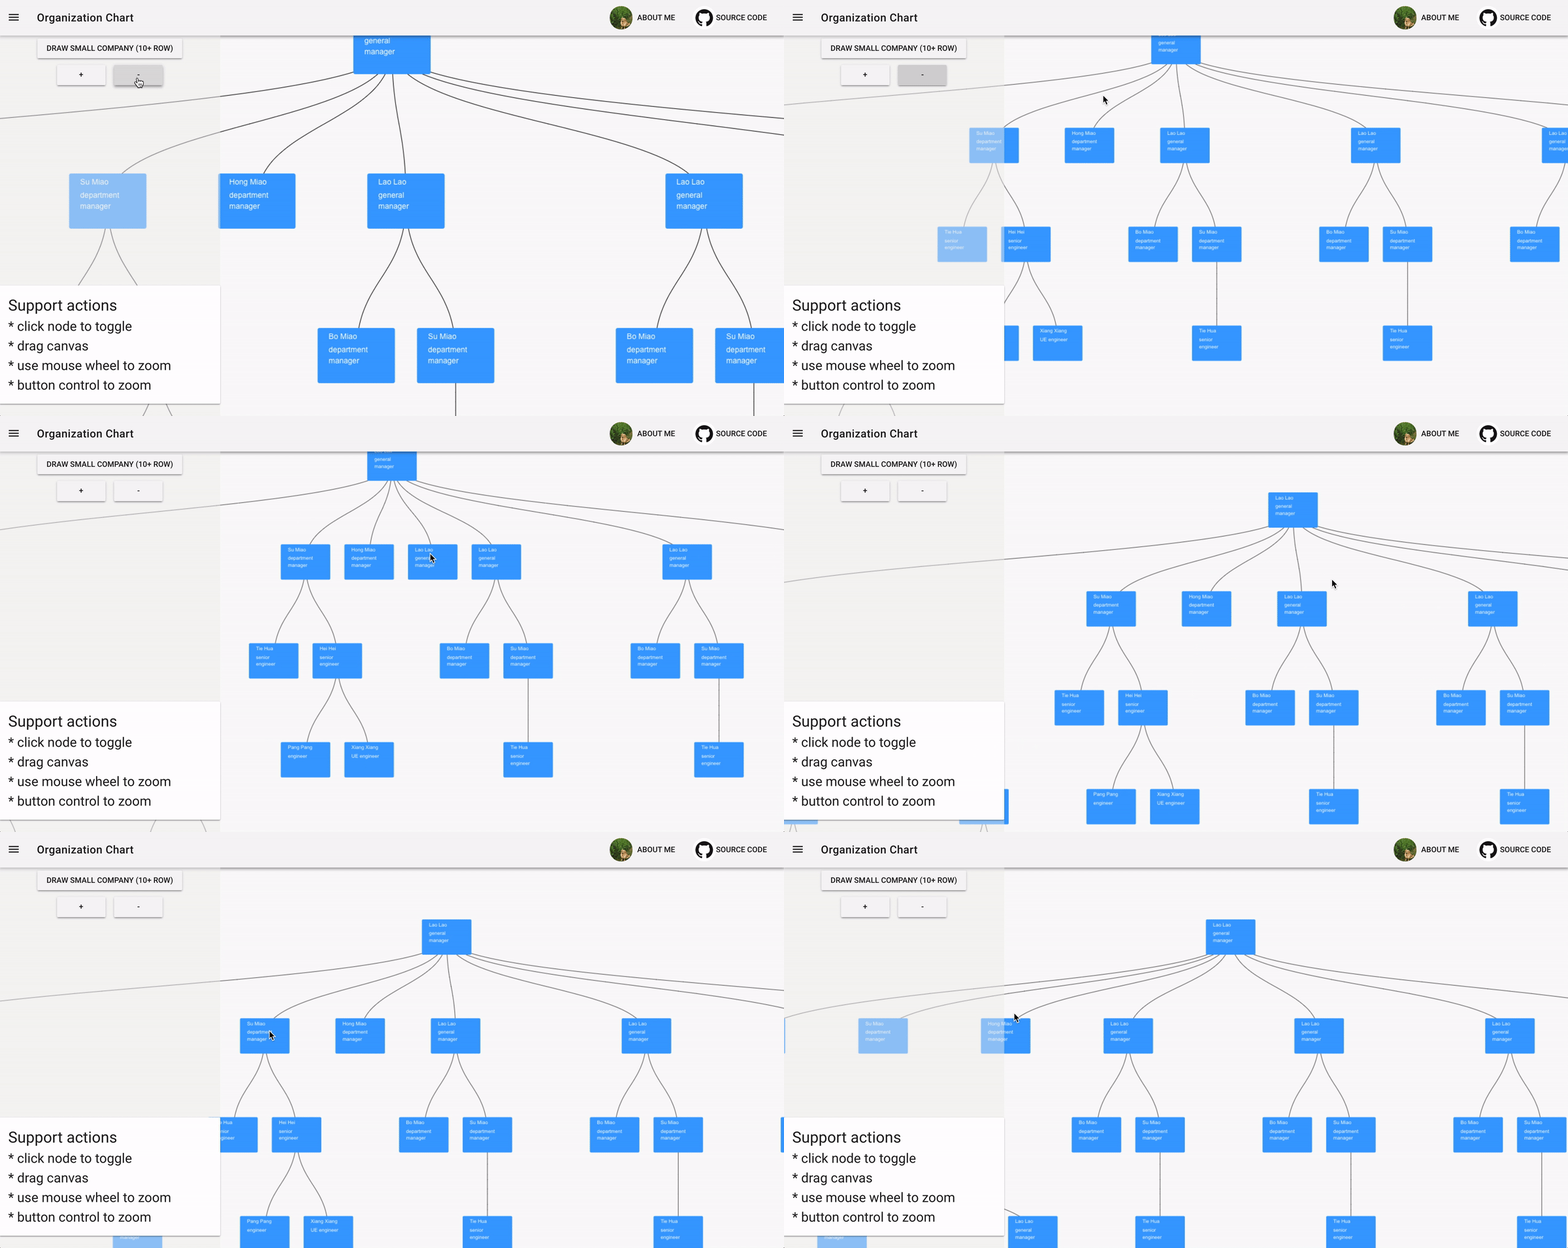
Demo 动图

demo gif

使用到的技术点

Svg 版本

  • 使用 D3.js 计算节点链接线的坐标
  • 使用 Vue 控制 DOM 节点的变更
  • 使用 Vue slot 抽象节点渲染流程, 让使用者可以高度定制化节点绘制

Canvas 版本

如何将图中数据替换为我的数据?

Svg version

Svg 版本通过 Vue 进行了良好的封装,使用起来非常方便且灵活.

1.安装

执行下面的命令安装 Svg 版本的 tree-chart

npm install @ssthouse/vue-tree-chart

2. 注册 vue-tree 组件

import VueTree from "@ssthouse/vue-tree-chart";
import Vue from "vue";
Vue.component("vue-tree", VueTree);

3. 使用组件

3.1 基本用法

See Code
<template>
  <div class="container">
    <vue-tree
      style="width: 800px; height: 600px; border: 1px solid gray;"
      :dataset="sampleData"
      :config="treeConfig"
    >
    </vue-tree>
  </div>
</template>

<script>
export default {
  name: 'treemap',
  data() {
    return {
      sampleData: {
        value: '1',
        children: [
          { value: '2', children: [{ value: '4' }, { value: '5' }] },
          { value: '3' }
        ]
      },
      treeConfig: { nodeWidth: 120, nodeHeight: 80, levelHeight: 200 }
    }
  }
}
</script>

<style scoped lang="less">
.container {
  display: flex;
  flex-direction: column;
  align-items: center;
}
</style>

3.2 使用 vue-slot 异化展示折叠节点

See Code
<template>
  <div class="container">
    <vue-tree
      style="width: 800px; height: 600px; border: 1px solid gray;"
      :dataset="sampleData"
      :config="treeConfig"
    >
      <template v-slot:node="{ node, collapsed }">
        <span
          class="tree-node"
          :style="{ border: collapsed ? '2px solid grey' : '' }"
          >{{ node.value }}</span
        >
      </template>
    </vue-tree>
  </div>
</template>

<script>
export default {
  name: 'treemap',
  data() {
    return {
      sampleData: {
        value: '1',
        children: [
          { value: '2', children: [{ value: '4' }, { value: '5' }] },
          { value: '3' }
        ]
      },
      treeConfig: { nodeWidth: 120, nodeHeight: 80, levelHeight: 200 }
    }
  }
}
</script>

<style scoped lang="less">
.container {
  display: flex;
  flex-direction: column;
  align-items: center;
}

.tree-node {
  display: inline-block;
  width: 28px;
  height: 28px;
  border-radius: 50%;
  background-color: antiquewhite;
  text-align: center;
  line-height: 28px;
}
</style>

3.3 自定义渲染富媒体节点

See Code
<template>
  <div class="container">
    <vue-tree
      style="width: 1000px; height: 600px; border: 1px solid gray;"
      :dataset="richMediaData"
      :config="treeConfig"
    >
      <template v-slot:node="{ node, collapsed }">
        <div
          class="rich-media-node"
          :style="{ border: collapsed ? '2px solid grey' : '' }"
        >
          <img
            :src="node.avatar"
            style="width: 48px; height: 48px; border-raduis: 4px;"
          />
          <span style="padding: 4px 0; font-weight: bold;"
            >能力值{{ node.value }}</span
          >
        </div>
      </template>
    </vue-tree>
  </div>
</template>

<script>
export default {
  name: 'treemap',
  data() {
    return {
      richMediaData: {
        name: 'James',
        value: 800,
        avatar:
          'https://gravatar.com/avatar/db51fdaf64d942180b5200ca37d155a4?s=400&d=robohash&r=x',
        children: [
          {
            name: 'Bob',
            value: 400,
            avatar:
              'https://gravatar.com/avatar/16b3b886b837257757c5961513396a06?s=400&d=robohash&r=x',
            children: [
              {
                name: 'C1',
                value: 100,
                avatar:
                  'https://gravatar.com/avatar/4ee8775f23f12755db978cccdc1356d9?s=400&d=robohash&r=x'
              },
              {
                name: 'C2',
                value: 300,
                avatar:
                  'https://gravatar.com/avatar/d3efa8fa639bdada96a7d0b4372e0a96?s=400&d=robohash&r=x'
              },
              {
                name: 'C3',
                value: 200,
                avatar:
                  'https://gravatar.com/avatar/4905bc3e5dc51a61e3b490ccf1891107?s=400&d=robohash&r=x'
              }
            ]
          },
          {
            name: 'Smith',
            value: 200,
            avatar:
              'https://gravatar.com/avatar/d05d081dbbb513180025300b715d5656?s=400&d=robohash&r=x',
            children: [
              {
                name: 'S1',
                value: 230,
                avatar:
                  'https://gravatar.com/avatar/60c1e69e690d943c5dc06568148debc4?s=400&d=robohash&r=x'
              }
            ]
          },
          {
            name: 'Jackson',
            value: 300,
            avatar:
              'https://gravatar.com/avatar/581f7a711c815d9671c35ebd815ec1e4?s=400&d=robohash&r=x'
          }
        ]
      },
      treeConfig: { nodeWidth: 120, nodeHeight: 80, levelHeight: 200 }
    }
  }
}
</script>

<style scoped lang="less">
.container {
  display: flex;
  flex-direction: column;
  align-items: center;
}

.rich-media-node {
  width: 80px;
  padding: 8px;
  display: flex;
  flex-direction: column;
  align-items: flex-start;
  justify-content: center;
  color: white;
  background-color: #f7c616;
  border-radius: 4px;
}
</style>

4. API

4.1 props 参数

type default description
dataset Object null nested tree data
config Object {
nodeWidth: 100,
nodeHeight: 100,
levelHeight: 200
}
nodeWidth 和 nodeHeight 用于配置树状图节点大小. levelHeight 用于配置树状图一层的高度
linkStyle String 'curve' 控制连接线样式, 可选项: 'curve' 或 'straight'
direction string 'vertical' 控制树状图方向, 可选项: 'vertical' 或 'horizontal'

4.2 slot 参数

该组件仅支持 默认 slot.

基本用法如下所示:

<template v-slot:node="{ node, collapsed }">
  <span
    class="tree-node"
    :style="{ border: collapsed ? '2px solid grey' : '' }"
    >{{ node.value }}</span
  >
</template>

slot 提供两个参数用于渲染树状图节点内容。

slot param type description
node Object current node data to be rendered
collapsed Boolean current node collapse status

Canavs 版本

canvas 的版本, 因为其绘制过程较难抽象, 且仅仅在数据量较大的情况下才有意义,所以没有发布为 npm module.

如果你希望使用 canvas 版本的 tree-chart,可以将源代码下载下来,并进行一下步骤替换为自己的数据集:

  • /src/base/data-generator.js文件中的数据替换为你自己的数据.
  • /src/components/org-chart.js文件中,修改drawShowCanvas函数的绘制逻辑.

开始开发

# install dependencies
npm install

# serve with hot reload at localhost
npm run dev

# build for production with minification (build to ./docs folder, which can be auto servered by github page 🤓)
npm run build

空文件

简介

取消

发行版

暂无发行版

贡献者 (4)

全部

近期动态

5年前创建了仓库
不能加载更多了
马建仓 AI 助手
尝试更多
代码解读
代码找茬
代码优化
1
https://gitee.com/ahzg/vue-tree-chart.git
git@gitee.com:ahzg/vue-tree-chart.git
ahzg
vue-tree-chart
vue-tree-chart
master

搜索帮助