# san-devtools
**Repository Path**: baidu/san-devtools
## Basic Information
- **Project Name**: san-devtools
- **Description**: No description available
- **Primary Language**: Unknown
- **License**: MIT
- **Default Branch**: master
- **Homepage**: None
- **GVP Project**: No
## Statistics
- **Stars**: 0
- **Forks**: 0
- **Created**: 2020-12-23
- **Last Updated**: 2020-12-23
## Categories & Tags
**Categories**: Uncategorized
**Tags**: None
## README
San DevTools
Development tool for debugging [San.js](https://github.com/baidu/san) applications.
It is exists both as a browser extension and as a common line tool(works with other environments including Safari, IE, San Native and Electron.)
## 🎉 Features
- Provide local server command, support remote debugging.
- Built in Chrome Devtools for remote debug mobile page.
- Provide Chrome Extension.
- Support `San Native` debugging (waiting for release).
## 📦 Installation
### standalone
The standalone version exists as a command line tool, and install from NPM or Yarn.
```shell
npm i -g san-devtools
# OR
yarn global add san-devtools
```
### chrome extension
[Get the Chrome Extension](https://chrome.google.com/webstore/detail/san-devtools/pjnngoafflflkagpebgfifjejlnfhahc)
OR
Navigate to chrome://extensions in Chrome/Chromium to load the unpacked extension from dist directory.
## 🤝 Quick Start
### standalone
**First:** Start debugging server, and will auto open the remote inspector.
```shell
sand # short for san-devtools
# OR
san-devtools
```
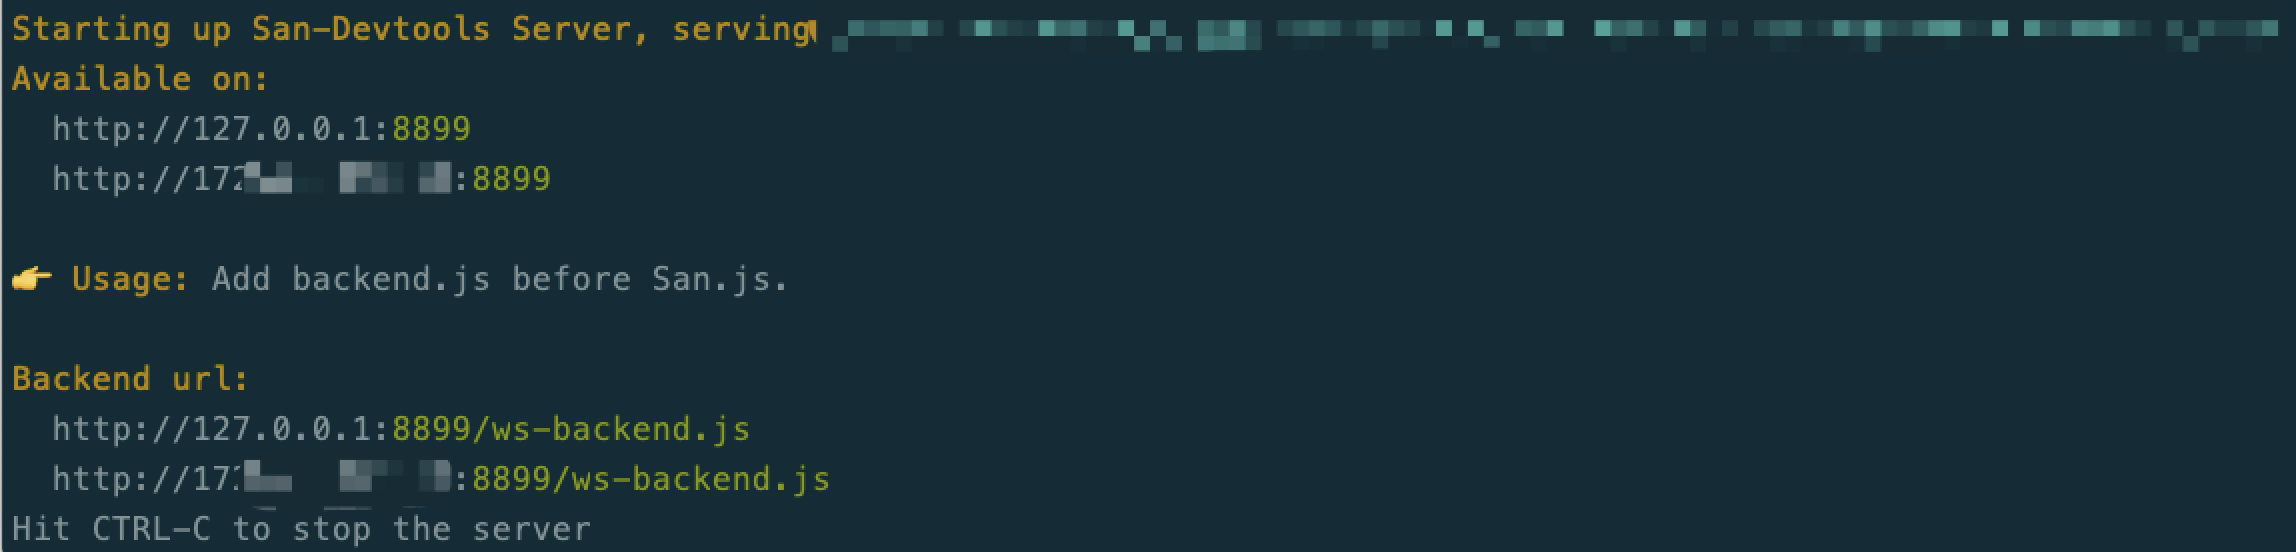
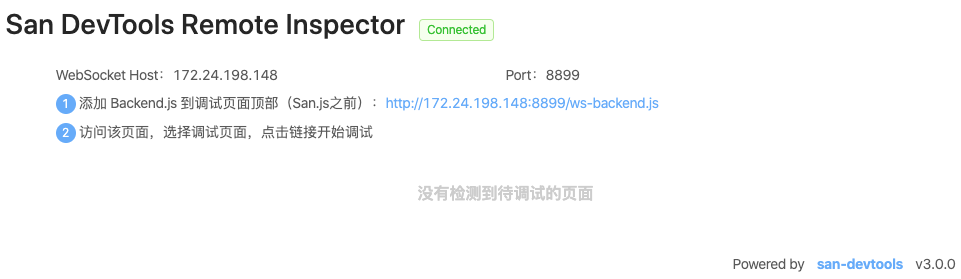
**Second:** Add `ws-backend.js` to the top of the debugging page(before san.js).
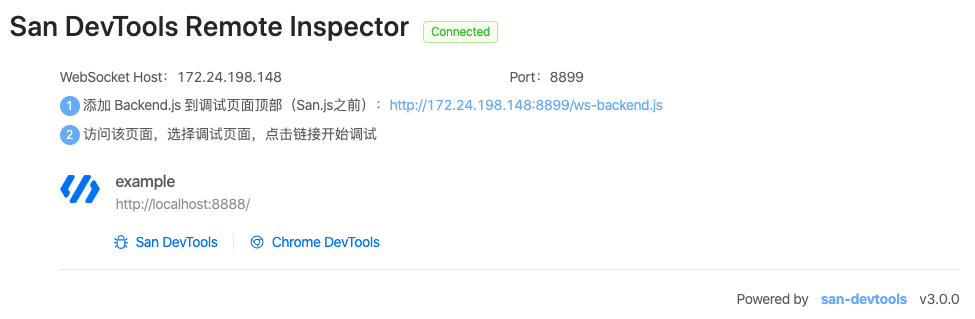
**Third:** Open the debugging page, and inspector page will auto connected.
### chrome extension
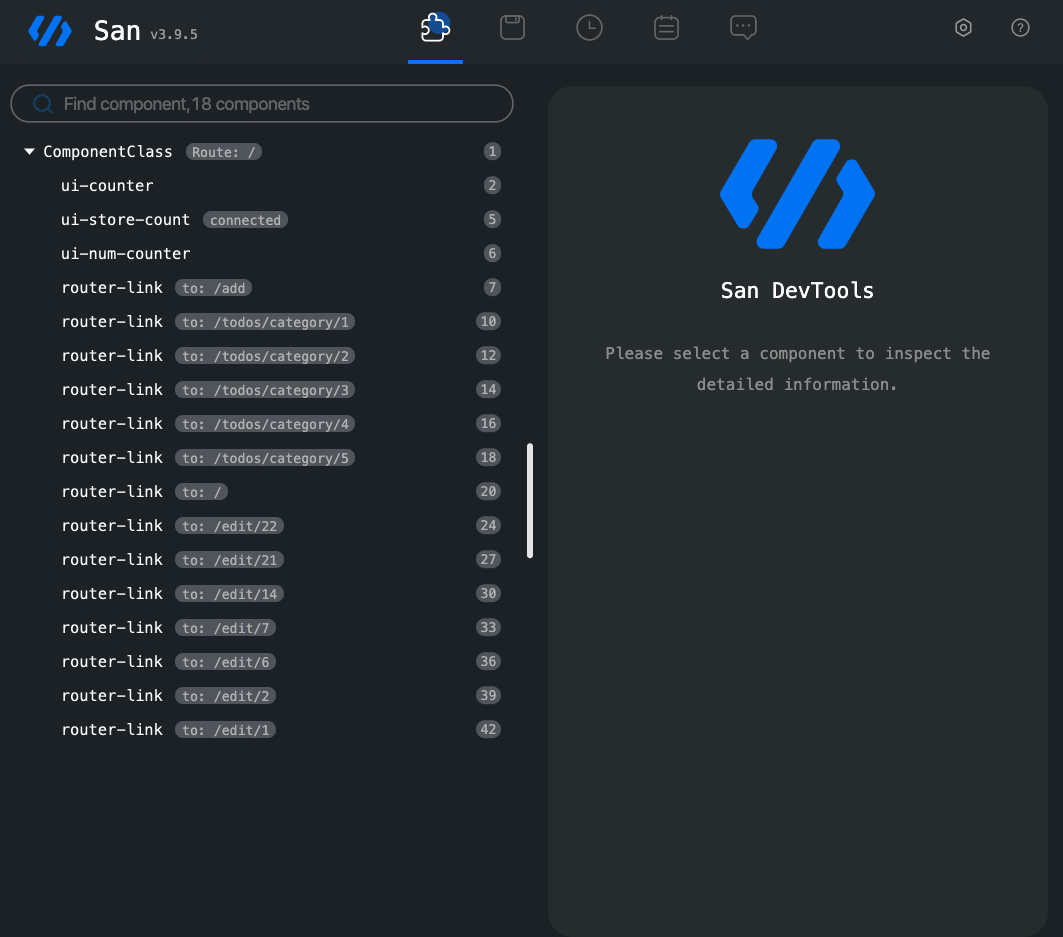
Open the debugging page and san-devtools plugin will show the San version, then open the chrome devtool and will see the San tab.
#### sand options
- --open, -o: Open browser when server start(default: true)
- --port, -p: Port to use (default: 8899)
- --address, -a: Address to use
- --version, -v: Show version number
- --help, -h: Show help
## 🍻 Companions
- [san-devtools](https://github.com/baidu/san-devtools/blob/master/docs/user_guide.md) - Chrome DevTools extension
- [san-router](https://github.com/baidu/san-router) - SPA Router
- [san-store](https://github.com/baidu/san-store) - Application States Management
- [san-update](https://github.com/baidu/san-update) - Immutable Data Update
- [san-factory](https://github.com/baidu/san-factory) - Component register and instantiation
- [santd](https://ecomfe.github.io/santd/) - Components Library following the [Ant Design](https://ant.design/) specification
- [san-mui](https://ecomfe.github.io/san-mui/) - [Material Design](https://www.material.io/) Components Library
- [san-xui](https://ecomfe.github.io/san-xui/) - A Set of SAN UI Components that widely used on Baidu Cloud Console
- [drei](https://github.com/ssddi456/drei/) - VSCode extension for SAN
- [san-cli](https://github.com/ecomfe/san-cli) - A CLI tooling based on SAN for rapid development
- [san-test-utils](https://github.com/ecomfe/san-test-utils) - The unit testing utility library for SAN
- [san-loader](https://github.com/ecomfe/san-loader) - Webpack loader for single-file SAN components
- [san-hot-loader](https://github.com/ecomfe/san-hot-loader) - Webpack loader for SAN components HMR
## ☀️ License
MIT