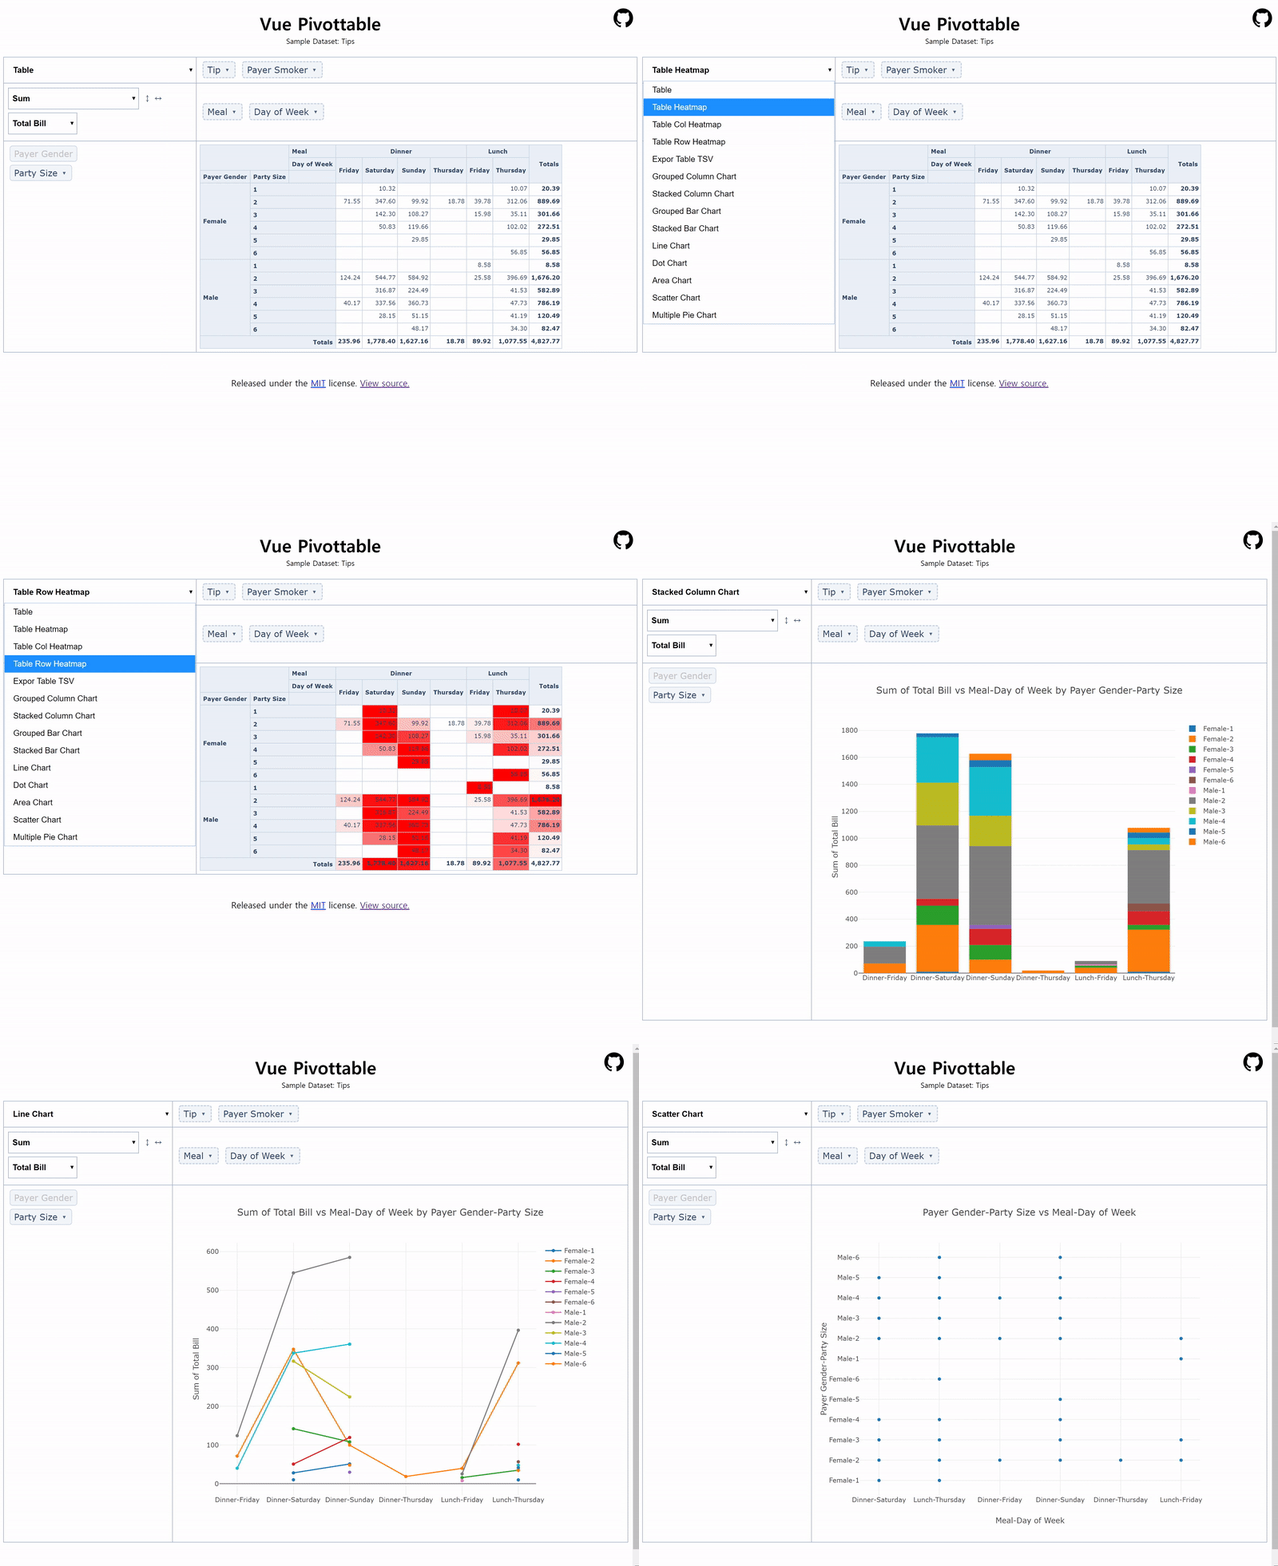
# vue-pivottable
**Repository Path**: brokge/vue-pivottable
## Basic Information
- **Project Name**: vue-pivottable
- **Description**: No description available
- **Primary Language**: Unknown
- **License**: MIT
- **Default Branch**: master
- **Homepage**: None
- **GVP Project**: No
## Statistics
- **Stars**: 3
- **Forks**: 0
- **Created**: 2021-03-10
- **Last Updated**: 2022-12-21
## Categories & Tags
**Categories**: Uncategorized
**Tags**: None
## README
# Vue Pivottable
It is a Vue port of the jQuery-based [PivotTable.js](https://pivottable.js.org/)
[](https://npmjs.com/package/vue-pivottable)
[](https://npmjs.com/package/vue-pivottable)
[](https://flat.badgen.net/npm/license/vue-pivottable)
[](https://www.jsdelivr.com/package/npm/vue-pivottable)
## Live Demo
[link](https://jsfiddle.net/front123/repqmz3f/)
## Run Demo
```bash
$ git clone https://github.com/Seungwoo321/vue-pivottable.git
$ cd vue-pivottable/demo/example-vue-cli3/
$ npm install
$ npm run serve
```

## Installation
```shall
npm i vue-pivottable
```
## Usage
### Global Compoents
main.js
```js
import Vue from 'vue'
import VuePivottable from 'vue-pivottable'
import 'vue-pivottable/dist/vue-pivottable.css'
Vue.use(VuePivottable)
```
_vue template_
* vue-pivottable
```html
Pivottable Demo
```
or
* vue-pivottable-ui
```html
Pivottable Demo
```
### Component style
app.vue
```html
Pivottable Demo
Pivottable Ui Demo
```
### PivotUtilities
- Example code [link](https://github.com/Seungwoo321/vue-pivottable/blob/master/demo/example-vue-cli3/src/App.vue)
- Data derivers, Sort overriding and custom heatmap colors...
- e.g. `aggregatorTemplates`, `aggregators`, `derivers`, `locales`, `naturalSort`, `numberFormat`, `getSort`, `sortAs`, `PivotDat`
```js
import { PivotUtilities } from 'vue-pivottable'
const aggregatorTemplates = PivotUtilities.aggregatorTemplates
const aggregators = PivotUtilities.aggregators
const derivers = PivotUtilities.derivers
const locales = PivotUtilities.locales
const naturalSort = PivotUtilities.naturalSort
const numberFormat = PivotUtilities.numberFormat
const getSort = PivotUtilities.getSort
const sortAs = PivotUtilities.sortAs
const PivotData = PivotUtilities.PivotData
```
## Props
* See [`react-pivottable`](https://github.com/plotly/react-pivottable/blob/master/README.md#properties-and-layered-architecture) for details.
|Key|Type & Default Value| Description
|----|-------------------|---------------
|data|(none, required)| data to be summarized
|vals|`Array`
[]| attribute names used as arguments to aggregator (gets passed to aggregator generating function)
|cols|`Array`
[]| attribute names to prepopulate in cols area
|rows|`Array`
[]| attribute names to prepopulate in row area
|rowTotal|`Boolean`
true| show total of rows (has not `react-pivottable`)
|colTotal|`Boolean`
true| show total of cols (has not `react-pivottable`)
|aggregators|`Object` of functions
`aggregators` from `Utilites`|dictionary of generators for aggregation functions in dropdown (see [original PivotTable.js documentation](https://github.com/nicolaskruchten/pivottable/wiki/Aggregators))
|aggregatorName|`String`
first key in `aggregators` | key to `aggregators` object specifying the aggregator to use for computations
|rendererName|`String`
Table | key to renderers object specifying the renderer to use
|valueFilter|`Object`
{} | object whose keys are attribute names and values are objects of attribute value-boolean pairs which denote records to include or exclude from computation and rendering; used to prepopulate the filter menus that appear on double-click
|sorters|`Function or Object`
{} | accessed or called with an attribute name and can return a function which can be used as an argument to array.sort for output purposes.
See [`react-pivottable`](https://github.com/plotly/react-pivottable/blob/master/README.md#properties-and-layered-architecture) for details.
|derivedAttributes|`Object`
{} | derivedAttributes | defines derived attributes
|rowOrder|`String`
key_a_to_z | the order in which row data is provided to the renderer, must be one of `"key_a_to_z"`, `"value_a_to_z"`, `"value_z_to_a"`, ordering by value orders by row total
|colOrder|`String`
key_a_to_z | the order in which column data is provided to the renderer, must be one of `"key_a_to_z"`, `"value_a_to_z"`, `"value_z_to_a"`, ordering by value orders by column total
|tableMaxWidth|`Number`
0 | value of max-width in table style
|hiddenAttributes|`Array`
[] | contains attribute names to omit from the UI
|hiddenFromAggregators|`Array`
[] |contains attribute names to omit from the aggregator arguments dropdowns
|hiddenFromDragDrop|`Array`
[] | contains attribute names to omit from the aggregator arguments dropdowns
|sortonlyFromDragDrop|`Array`
[] | contains attribute names to sort from the drag'n'drop of the UI (has not `react-pivottable`)
|disabledFromDragDrop|`Array`
[] |contains attribute names to disable from the drag'n'drop portion of the UI (has not `react-pivottable`)
|menuLimit|`Number`
500| maximum number of values to list in the double-click menu
|tableColorScaleGenerator|`Function`
undefined| generate custom color render for `Table Heatmap` |
## Inspired
* [plotly/react-pivottable](https://github.com/plotly/react-pivottable) - React-based pivot table library
* [David-Desmaisons/vue-plotly](https://github.com/David-Desmaisons/vue-plotly) - vue wrapper for plotly.js
## License
MIT