# ZoomPlot-MATLAB2
**Repository Path**: brucehui2022/zoom-plot-matlab2-z
## Basic Information
- **Project Name**: ZoomPlot-MATLAB2
- **Description**: No description available
- **Primary Language**: Matlab
- **License**: BSD-3-Clause
- **Default Branch**: main
- **Homepage**: None
- **GVP Project**: No
## Statistics
- **Stars**: 0
- **Forks**: 0
- **Created**: 2023-11-01
- **Last Updated**: 2023-11-02
## Categories & Tags
**Categories**: Uncategorized
**Tags**: None
## README
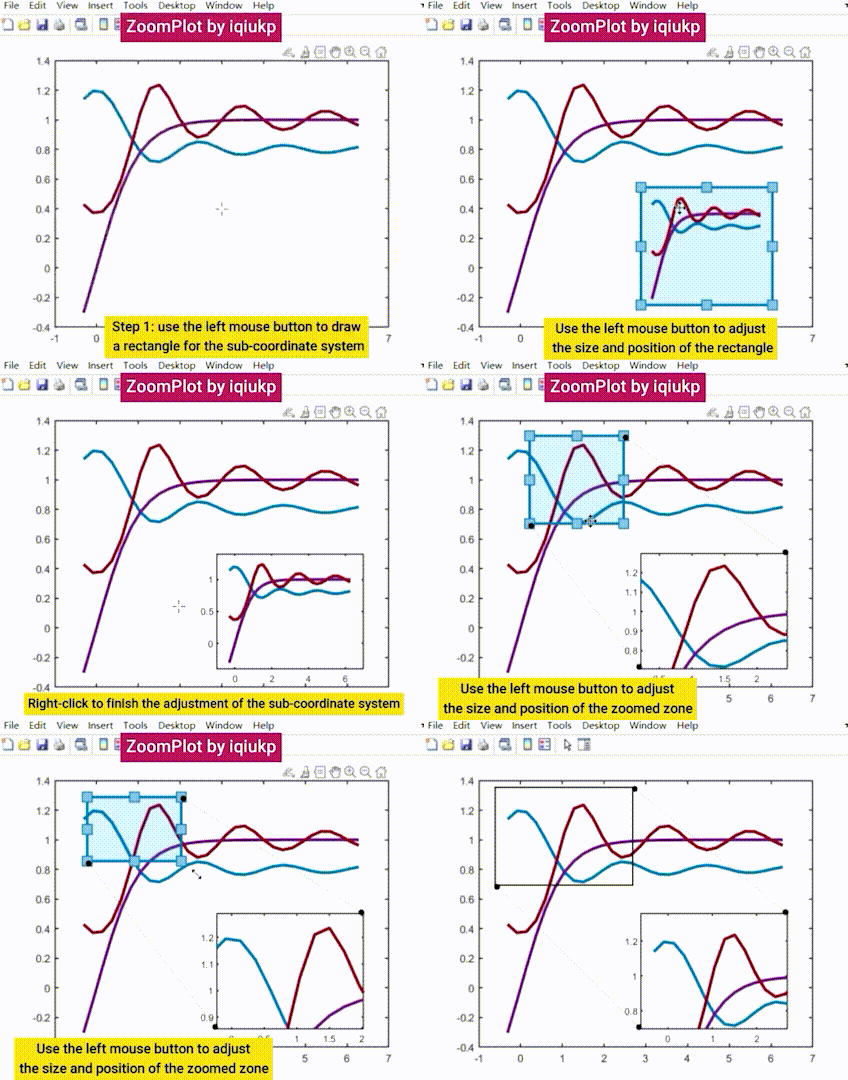
ZoomPlot
MATLAB Code for Interactive Magnification of Customized Regions.
Version 1.4, 30-MAY-2023
Email: iqiukp@outlook.com
## ✨ Main features
- Easy application with just two lines of code
- Interactive plotting
- Support for image and figure classes
- Support for multiple zoomed zones
- Custom settings of parameters and themes
## ⚠️ Requirements
- R2016a and later releases
- Image Processing Toolbox
## 👉 How to use
1. Add `BaseZoom.m` and `parameters.json` to MATLAB search path or current working directory
2. After completing the basic drawing, enter the following two lines of code in the command line window or your m-file:
```MATLAB
% add a zoomed zone
zp = BaseZoom();
zp.plot;
```
*if multiple zoomed zones are required, for example, 3 zoomed zones, the code are as follows:*
```MATLAB
% add 3 zoomed zones
zp = BaseZoom();
zp.plot;
zp.plot;
zp.plot;
```
## 👉 Examples for image class
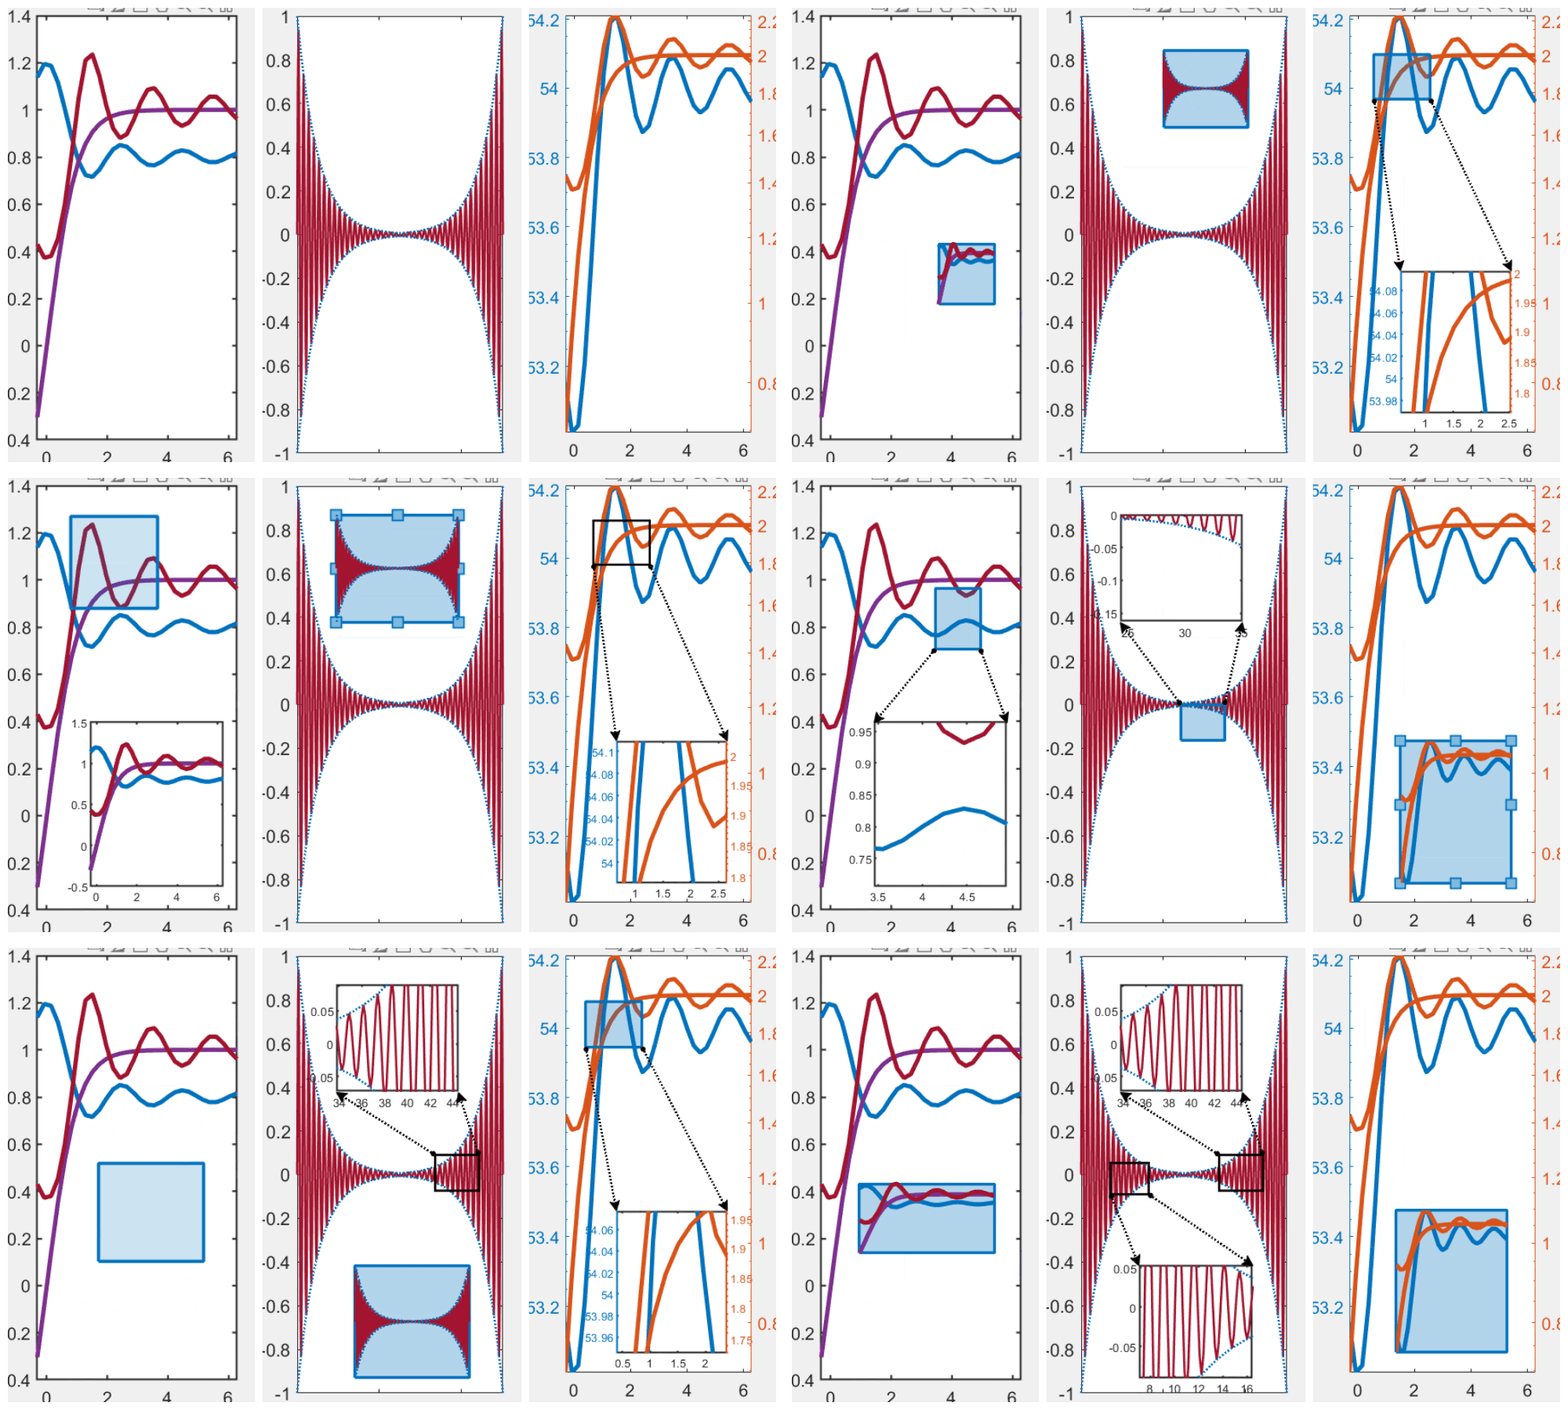
Multiple types of image are supported for interactive magnification of customized regions in the `ZoomPlot`.

## 👉 Examples for figure class
Multiple zoomed zones are supported for figure class.
## 👉 Customize parameters using json files
ZoomPlot's configuration parameters are stored in `parameters.json` and have the following default values:
```json
{
"subAxes":
{
"Color": "none",
"LineWidth": 1.2,
"XGrid": "off",
"YGrid": "off",
"ZGrid": "off",
"GridAlpha": 0.15,
"GridColor": [0.15, 0.15, 0.15],
"GridLineStyle": "-",
"Box": "on",
"TickDir": "in",
"Comments": "theme of the sub axes"
},
"zoomedArea":
{
"Color": "k",
"FaceColor": "none",
"FaceAlpha": 0,
"LineStyle": "-",
"LineWidth": 1.5,
"Comments": "theme of the zoomed area"
},
"dynamicRect":
{
"LineColor": [0, 0.4471, 0.7412],
"LineWidth": 2,
"Marker": "s",
"MarkerSize": 9,
"FaceColor": [0, 0.4471, 0.7412],
"FaceAspect": 0.3,
"EdgeColor": "k",
"Comments": "theme of the zoomed area"
},
"connection":
{
"LineColor": "k",
"LineWidth": 1.5,
"LineStyle": ":",
"StartHeadStyle": "ellipse",
"StartHeadLength": 3,
"StartHeadWidth": 3,
"EndHeadStyle": "cback2",
"EndHeadLength": 7,
"EndHeadWidth": 7,
"Comments": "theme of the zoomed area"
}
}
```
As you can see, there are four sections of configuration parameters:
- `subAxes` (sub coordinate system)
- `zoomedArea` (zoomed area)
- `dynamicRect` (dynamic rectangle in the adjustment process)
- `connection` (the line connecting the sub coordinate system and the zoomed area)
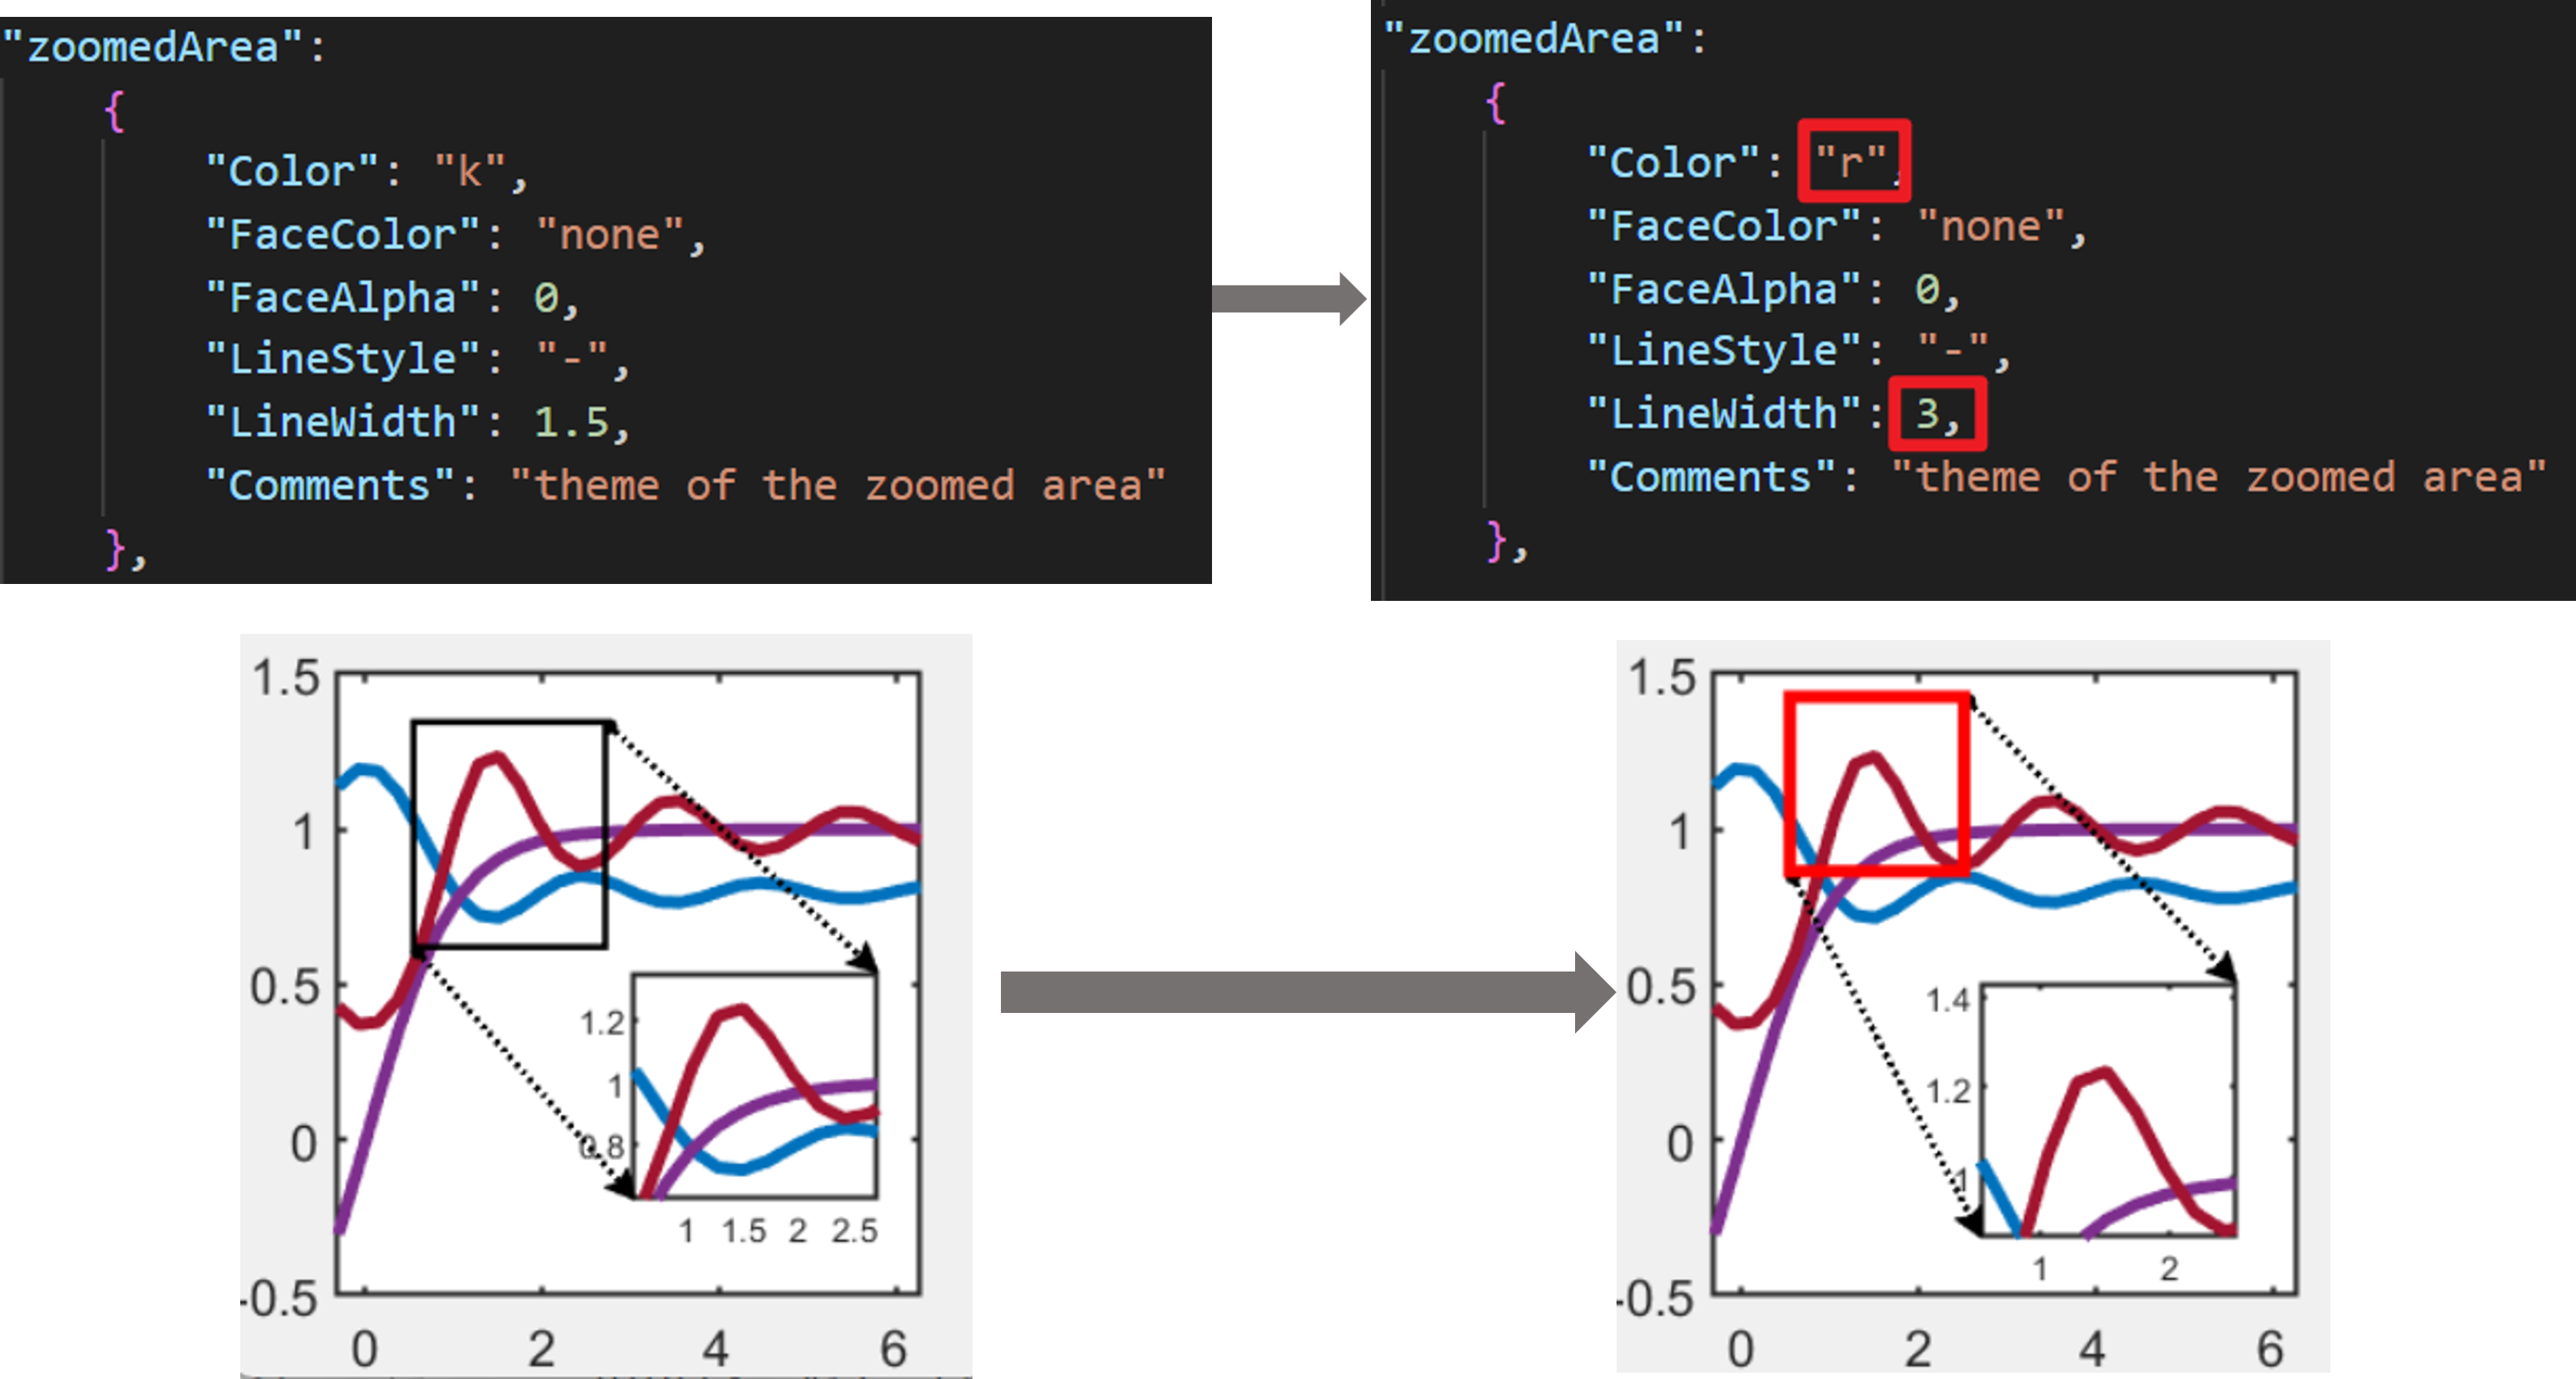
For example, the border of the zoomed area is changed to red, and the line width is changed to 3:
Another example, the color of the connecting line is changed to blue, the shape of the end arrow is changed to 'ellipse', and the line width is changed to 5:

## TODO
- [ ] Support for 3-D plots
- [ ] Support for input of position parameters for sub coordinate system and zoomed area using a four-element vector of the form `[left bottom width height]`
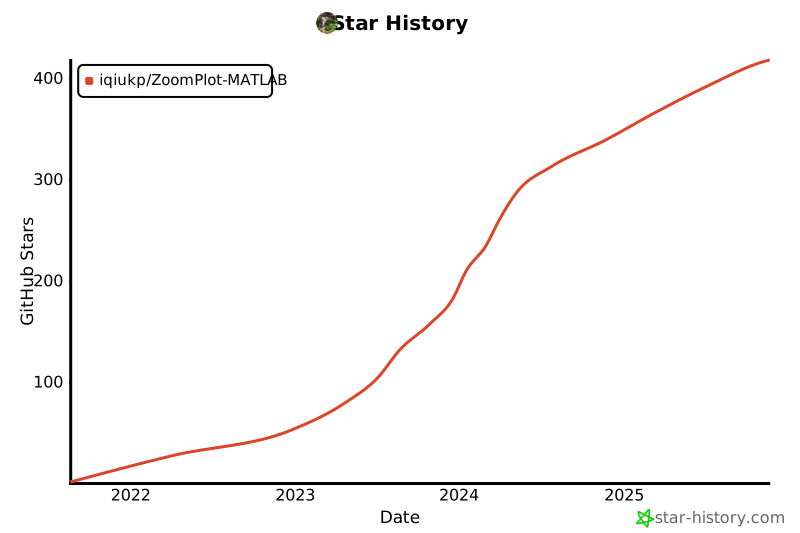
## Star History
[](https://star-history.com/#iqiukp/ZoomPlot-MATLAB) 




