# pygwalker
**Repository Path**: defangit_zhaozhishi/pygwalker
## Basic Information
- **Project Name**: pygwalker
- **Description**: 一款python数据分析可视化资源库,简单好用,引用自Kanaries,无魔改
- **Primary Language**: Python
- **License**: Apache-2.0
- **Default Branch**: main
- **Homepage**: None
- **GVP Project**: No
## Statistics
- **Stars**: 2
- **Forks**: 0
- **Created**: 2023-03-04
- **Last Updated**: 2024-04-21
## Categories & Tags
**Categories**: Uncategorized
**Tags**: None
## README

PyGWalker: A Python Library for Exploratory Data Analysis with Visualization


[**PyGWalker**](https://github.com/Kanaries/pygwalker) can simplify your Jupyter Notebook data analysis and data visualization workflow, by turning your pandas dataframe (and polars dataframe) into a Tableau-style User Interface for visual exploration.
**PyGWalker** (pronounced like "Pig Walker", just for fun) is named as an abbreviation of "**Py**thon binding of **G**raphic **Walker**". It integrates Jupyter Notebook (or other jupyter-based notebooks) with [Graphic Walker](https://github.com/Kanaries/graphic-walker), a different type of open-source alternative to Tableau. It allows data scientists to analyze data and visualize patterns with simple drag-and-drop operations.
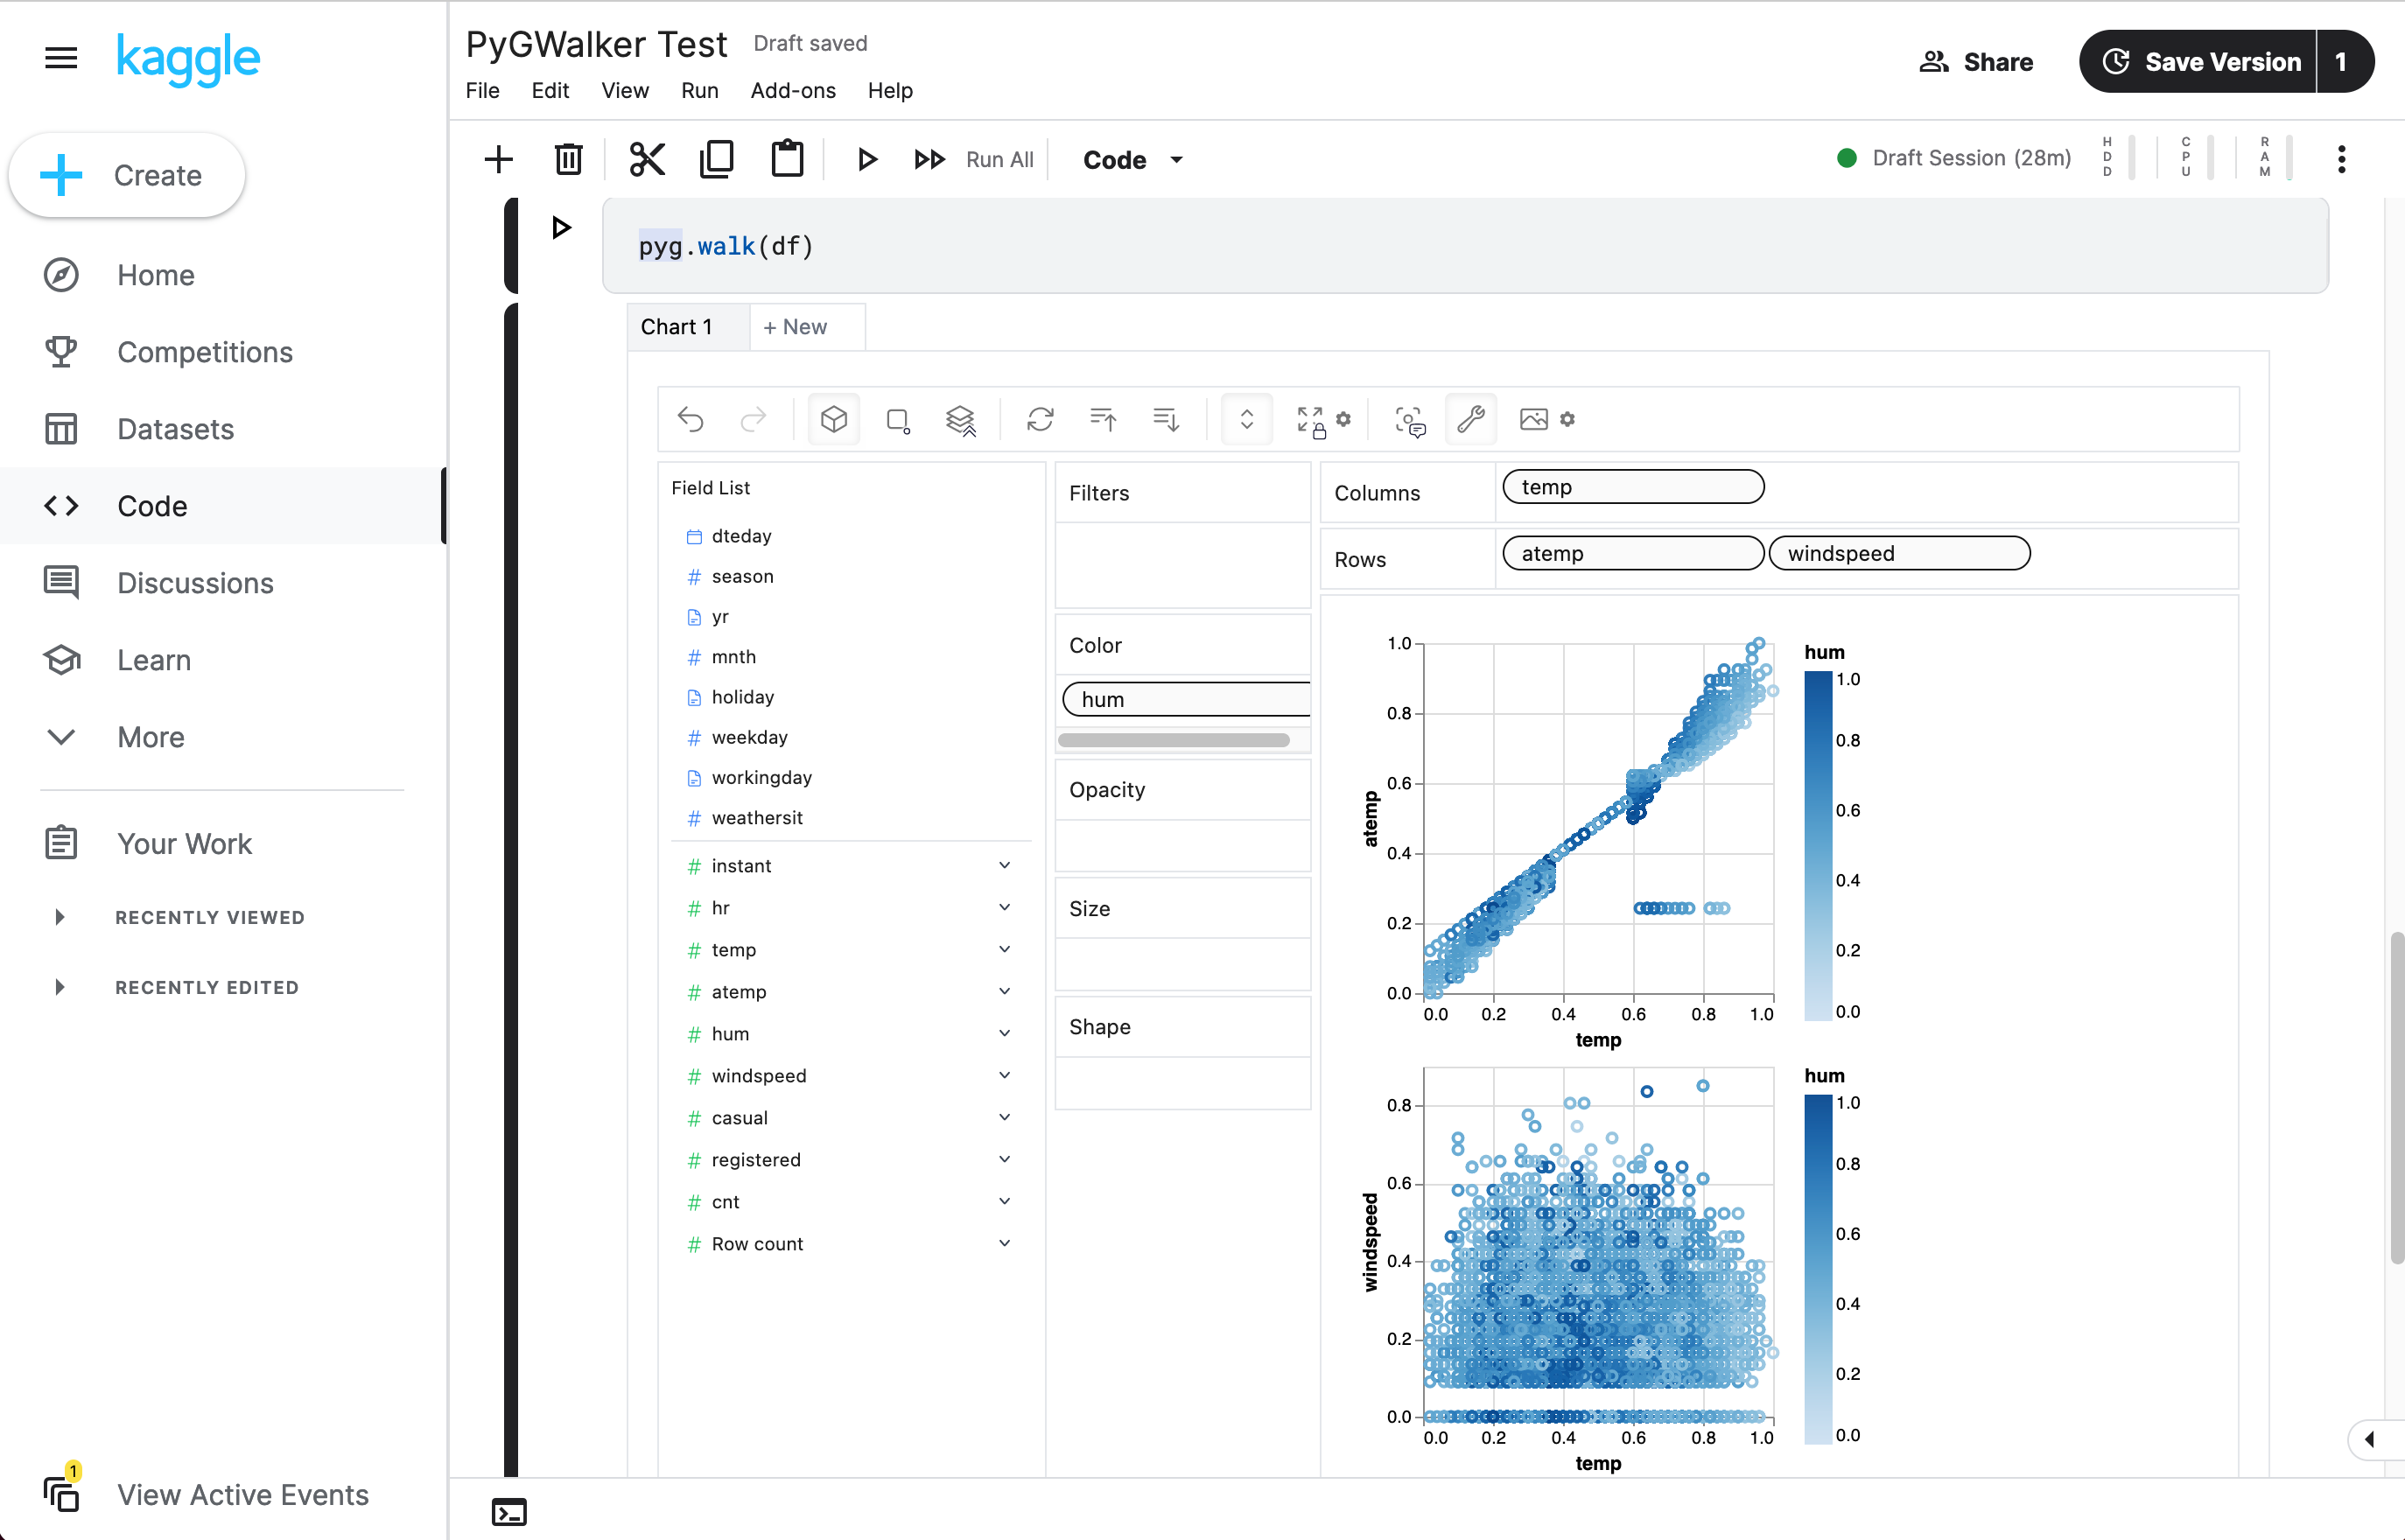
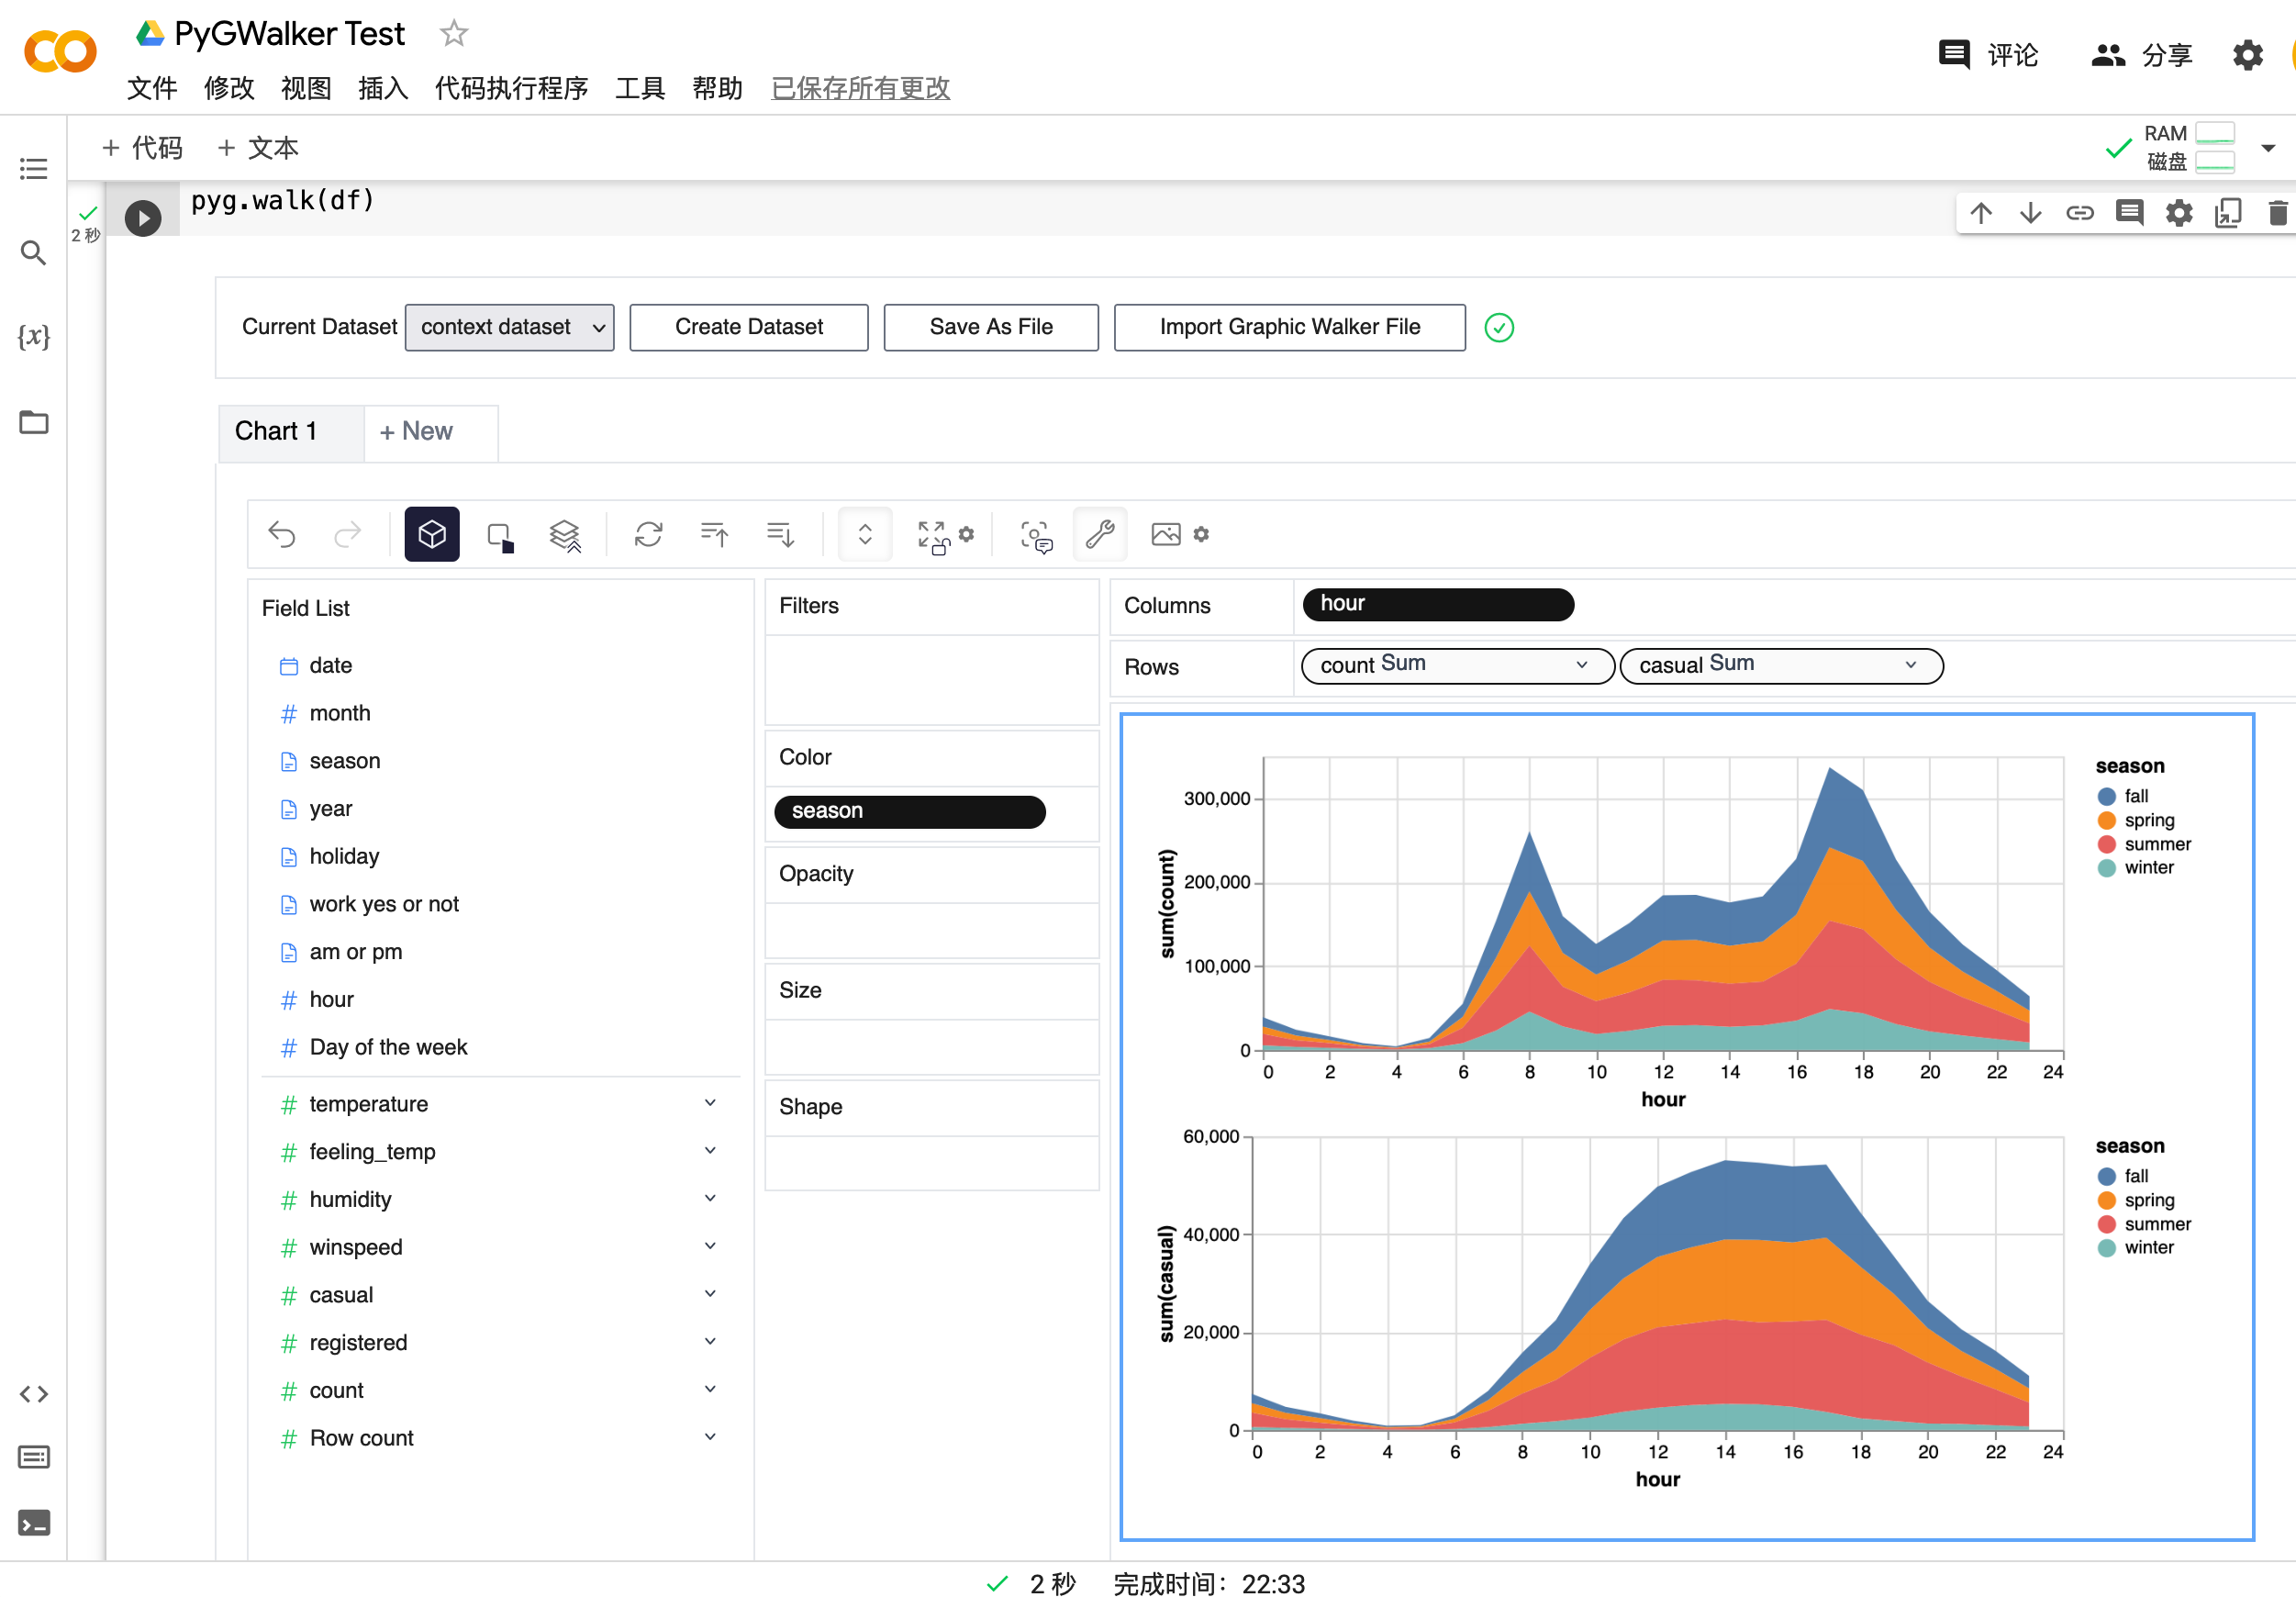
Visit [Google Colab](https://colab.research.google.com/drive/171QUQeq-uTLgSj1u-P9DQig7Md1kpXQ2?usp=sharing), [Kaggle Code](https://www.kaggle.com/asmdef/pygwalker-test), [](https://mybinder.org/v2/gh/Kanaries/pygwalker/main?labpath=tests%2Fmain.ipynb) or [Graphic Walker Online Demo](https://graphic-walker.kanaries.net/) to test it out!
> PyGWalker will add more support such as R in the future.
# Getting Started
## Tested Environments
- [x] Jupyter Notebook
- [x] Google Colab
- [x] Kaggle Code
- [x] Jupyter Lab (WIP: There're still some tiny CSS issues)
- [x] Databricks Notebook (Since version `0.1.4`)
- [x] Jupyter Extension for Visual Studio Code (Since version `0.1.4`)
- [x] Hex Projects (Since version `0.1.4`)
- [x] Most web applications compatiable with IPython kernels. (Since version `0.1.4`)
- [ ] ...feel free to raise an issue for more environments.
## Setup pygwalker
Before using pygwalker, make sure to install the packages through the command line using pip or conda.
### pip
```bash
pip install pygwalker
```
> **Note**
>
> For an early trial, you can install with `pip install pygwalker --upgrade` to keep your version up to date with the latest release or even `pip install git+https://github.com/Kanaries/pygwalker@main` to obtain latest features and bug-fixes.
### Conda-forge
```bash
conda install -c conda-forge pygwalker
```
or
```bash
mamba install -c conda-forge pygwalker
```
See [conda-forge feedstock](https://github.com/conda-forge/pygwalker-feedstock) for more help.
## Use pygwalker in Jupyter Notebook
Import pygwalker and pandas to your Jupyter Notebook to get started.
```python
import pandas as pd
import pygwalker as pyg
```
You can use pygwalker without breaking your existing workflow. For example, you can call up Graphic Walker with the dataframe loaded in this way:
```python
df = pd.read_csv('./bike_sharing_dc.csv', parse_dates=['date'])
gwalker = pyg.walk(df)
```
And you can use pygwalker with polars (since `pygwalker>=0.1.4.7a0`):
```python
import polars as pl
df = pl.read_csv('./bike_sharing_dc.csv',try_parse_dates = True)
gwalker = pyg.walk(df)
```
You can even try it online, simply visiting [](https://mybinder.org/v2/gh/Kanaries/pygwalker/main?labpath=tests%2Fmain.ipynb), [Google Colab](https://colab.research.google.com/drive/171QUQeq-uTLgSj1u-P9DQig7Md1kpXQ2?usp=sharing) or [Kaggle Code](https://www.kaggle.com/code/asmdef/notebook1cc9d36936).
That's it. Now you have a Tableau-like user interface to analyze and visualize data by dragging and dropping variables.
Cool things you can do with Graphic Walker:
+ You can change the mark type into others to make different charts, for example, a line chart:

+ To compare different measures, you can create a concat view by adding more than one measure into rows/columns.

+ To make a facet view of several subviews divided by the value in dimension, put dimensions into rows or columns to make a facets view. The rules are similar to Tableau.

+ You can view the data frame in a table and configure the analytic types and semantic types.

+ You can save the data exploration result to a local file
For more detailed instructions, visit the [Graphic Walker GitHub page](https://github.com/Kanaries/graphic-walker).
# License
[Apache License 2.0](https://github.com/Kanaries/pygwalker/blob/main/LICENSE)
# Resources
+ Check out more resources about Graphic Walker on [Graphic Walker GitHub](https://github.com/Kanaries/graphic-walker)
+ We are also working on [RATH](https://kanaries.net): an Open Source, Automate exploratory data analysis software that redefines the workflow of data wrangling, exploration and visualization with AI-powered automation. Check out the [Kanaries website](https://kanaries.net) and [RATH GitHub](https://github.com/Kanaries/Rath) for more!
+ If you encounter any issues and need support, join our [Slack](https://join.slack.com/t/kanaries-community/shared_invite/zt-1pcosgbua-E_GBPawQOI79C41dPDyyvw) or [Discord](https://discord.gg/Z4ngFWXz2U) channels.
+ Share pygwalker on these social media platforms:
[](https://reddit.com/submit?url=https://github.com/Kanaries/pygwalker&title=Say%20Hello%20to%20pygwalker%3A%20Combining%20Jupyter%20Notebook%20with%20a%20Tableau-like%20UI)
[](https://news.ycombinator.com/submitlink?u=https://github.com/Kanaries/pygwalker)
[](https://twitter.com/share?url=https://github.com/Kanaries/pygwalker&text=Say%20Hello%20to%20pygwalker%3A%20Combining%20Jupyter%20Notebook%20with%20a%20Tableau-like%20UI)
[](https://www.facebook.com/sharer/sharer.php?u=https://github.com/Kanaries/pygwalker)
[](https://www.linkedin.com/shareArticle?url=https://github.com/Kanaries/pygwalker&&title=Say%20Hello%20to%20pygwalker%3A%20Combining%20Jupyter%20Notebook%20with%20a%20Tableau-like%20UI)