# lets-plot
**Repository Path**: hhdych_admin/lets-plot
## Basic Information
- **Project Name**: lets-plot
- **Description**: No description available
- **Primary Language**: Unknown
- **License**: MIT
- **Default Branch**: master
- **Homepage**: None
- **GVP Project**: No
## Statistics
- **Stars**: 0
- **Forks**: 1
- **Created**: 2024-01-10
- **Last Updated**: 2024-05-29
## Categories & Tags
**Categories**: Uncategorized
**Tags**: None
## README
# Lets-Plot
[](https://confluence.jetbrains.com/display/ALL/JetBrains+on+GitHub)
[](https://raw.githubusercontent.com/JetBrains/lets-plot-kotlin/master/LICENSE)
[](https://github.com/JetBrains/lets-plot-kotlin/releases/latest)
**Lets-Plot** is a multiplatform plotting library based on the Grammar of Graphics.
The library' design is heavily influenced by Leland Wilkinson work [The Grammar of Graphics](https://www.goodreads.com/book/show/2549408.The_Grammar_of_Graphics) describing the deep features that underlie all statistical graphics.
> This grammar [...] is made up of a set of independent components that can be composed in many different ways. This makes [it] very powerful because you are not limited to a set of pre-specified graphics, but you can create new graphics that are precisely tailored for your problem.
> - Hadley Wickham, "[ggplot2: Elegant Graphics for Data Analysis](https://ggplot2-book.org/index.html)"
We provide ggplot2-like plotting API for Python and Kotlin users.
## Lets-Plot for Python [](https://pypi.org/project/lets-plot)
A bridge between R (ggplot2) and Python data visualization. \
To learn more see the documentation site at [lets-plot.org](https://lets-plot.org).
## Lets-Plot Kotlin API [](https://github.com/JetBrains/lets-plot-kotlin/releases/latest)
### Notebooks
Create plots in [Kotlin Notebook](https://plugins.jetbrains.com/plugin/16340-kotlin-notebook),
[Datalore](https://datalore.jetbrains.com/report/static/HZqq77cegYd.E7get_WnChZ/aTA9lQnPkRwdCzT6uy95GZ), [Jupyter with Kotlin Kernel](https://github.com/Kotlin/kotlin-jupyter#readme) \
or any other notebook that supports `Kotlin Kernel`. \
To learn more see the [Lets-Plot Kotlin API](https://github.com/JetBrains/lets-plot-kotlin) project at GitHub.
### Compose Multiplatform
Embed Lets-Plot charts in [Compose Multiplatform](https://github.com/JetBrains/compose-multiplatform) applications. \
To learn more see the [Lets-Plot Skia Frontend](https://github.com/JetBrains/lets-plot-skia) project at GitHub.
### JVM and Kotlin/JS
Embed Lets-Plot charts in JVM (Swing, JavaFX) and Kotlin/JS applications. \
To learn more see the [Lets-Plot Kotlin API](https://github.com/JetBrains/lets-plot-kotlin) project at GitHub.
## "Lets-Plot in SciView" plugin
[](http://plugins.jetbrains.com/plugin/14379-lets-plot-in-sciview)
[](http://plugins.jetbrains.com/plugin/14379-lets-plot-in-sciview)
*Scientific mode* in PyCharm and in IntelliJ IDEA provides support for interactive scientific computing and data visualization.
[*Lets-Plot in SciView*](https://plugins.jetbrains.com/plugin/14379-lets-plot-in-sciview) plugin adds
support for interactive plotting to IntelliJ-based IDEs with the *Scientific mode* enabled.
>
> **Note:** The *Scientific mode* is NOT available in communinty editions of JetBrains IDEs.
>
Also read:
- [Scientific mode in PyCharm](https://www.jetbrains.com/help/pycharm/matplotlib-support.html)
- [Scientific mode in IntelliJ IDEA](https://www.jetbrains.com/help/idea/matplotlib-support.html)
## What is new in 4.2.0
- #### Support for `"Categoricals"`
See: [example notebook](https://nbviewer.jupyter.org/github/JetBrains/lets-plot/blob/master/docs/f-23f/factor_levels.ipynb).
- #### Superscript for Numbers in Scientific Notation
> #### Warning!
>
> Do NOT(!) use `exponent_format='pow'` if you are planning to export plot to a raster format (PNG,PDF).
>
> The `CairoSVG` library (which is under the hood of our `ggsave()` function) does not handle `tspan` element properly end breaks superscript notation when transforming SVG to PNG/PDF.
>
> More details: https://github.com/Kozea/CairoSVG/issues/317
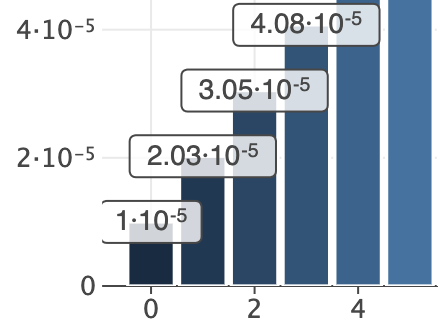 See: [example notebook](https://nbviewer.jupyter.org/github/JetBrains/lets-plot/blob/master/docs/f-23f/superscript_exponent.ipynb).
- #### Exporting Plot to a File-Like Object.
See: [example notebook](https://nbviewer.jupyter.org/github/JetBrains/lets-plot/blob/master/docs/f-23f/superscript_exponent.ipynb).
- #### Exporting Plot to a File-Like Object.
Convenience methods: `to_svg()`, `to_html()`, `to_png()`, `to_pdf()`
See: [example notebook](https://nbviewer.jupyter.org/github/JetBrains/lets-plot/blob/master/docs/f-23f/new_export_methods.ipynb).
- #### Sharing of X,Y-scale Limits Between Subplots in `gggrid()`
See: [example notebook](https://nbviewer.jupyter.org/github/JetBrains/lets-plot/blob/master/docs/f-23f/gggrid_scale_share.ipynb).
- #### `geom_spoke()`
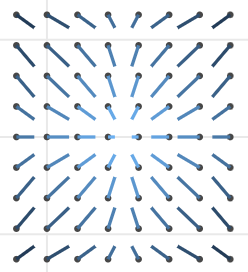 See: [example notebook](https://nbviewer.org/github/JetBrains/lets-plot/blob/master/docs/f-23f/geom_spoke.ipynb).
- #### High-contrast Tileset "BW" for `geom_livemap()`
See: [example notebook](https://nbviewer.org/github/JetBrains/lets-plot/blob/master/docs/f-23f/geom_spoke.ipynb).
- #### High-contrast Tileset "BW" for `geom_livemap()`
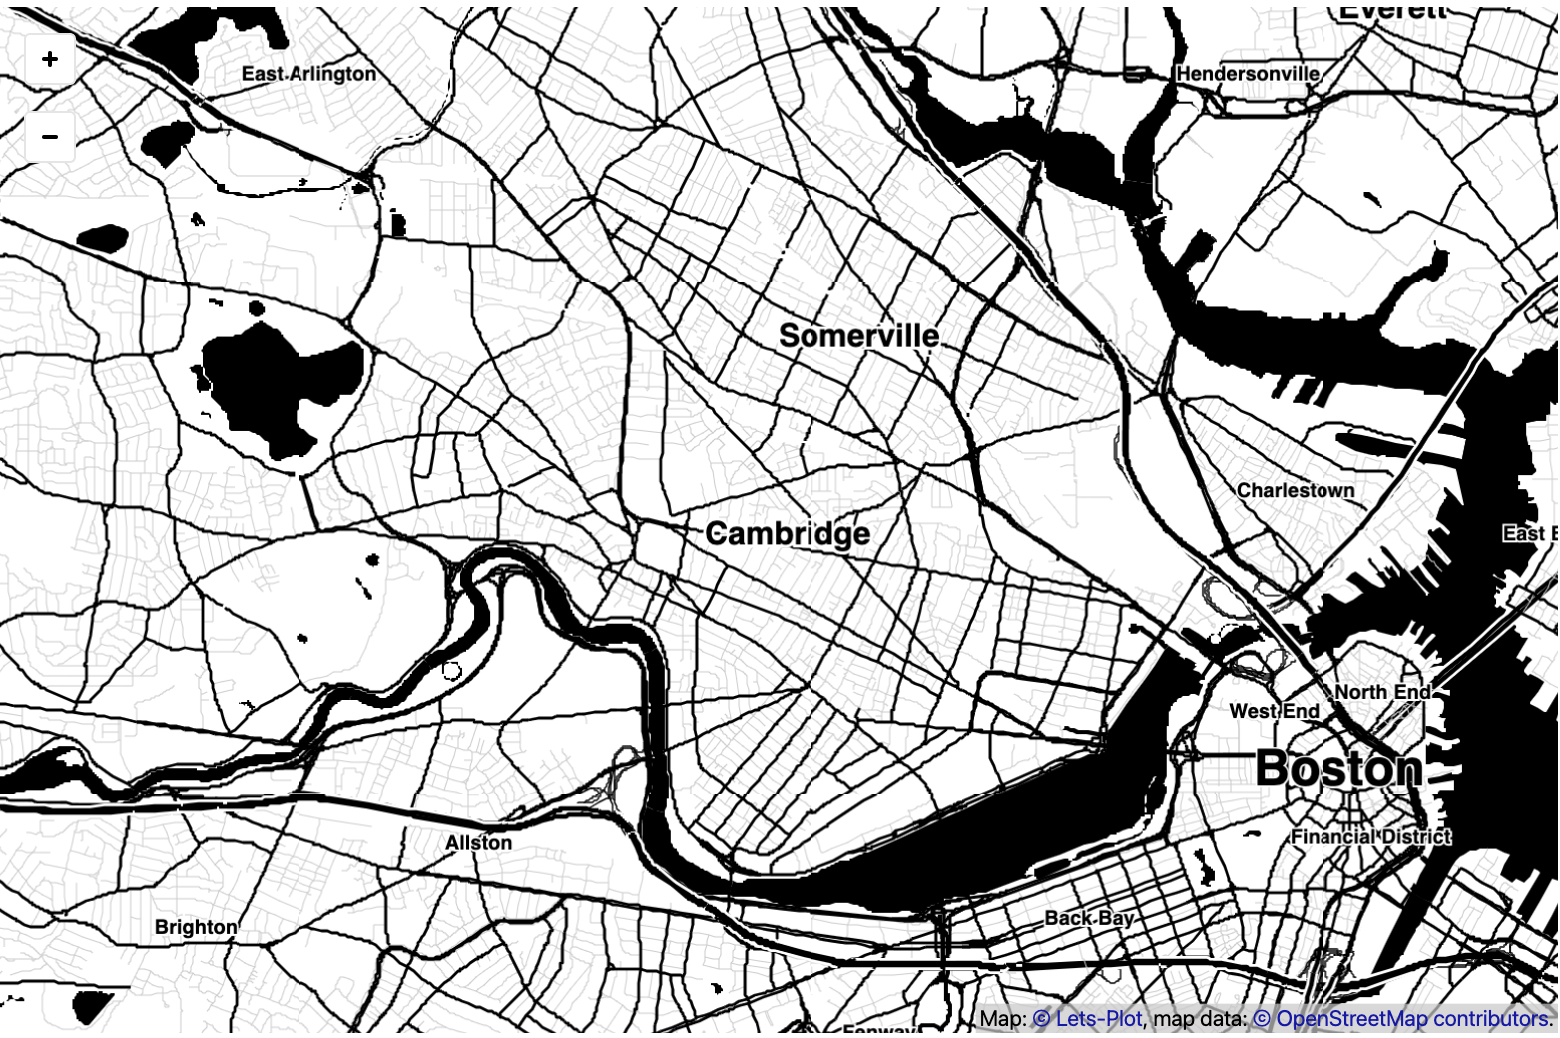 See: [example notebook](https://nbviewer.jupyter.org/github/JetBrains/lets-plot/blob/master/docs/f-23f/geom_livemap_bw_tiles.ipynb).
See advanced example: [Spatial prediction of soil pollutants with multi-output Gaussian processes](https://nextjournal.com/asmirnov-horis/spatial-prediction-of-soil-pollutants-with-multi-output-gaussian-processes?token=26GT2sBa3Ycw6LGZxqdTay). Credits: Essi Parent ([@essicolo](https://github.com/essicolo)).
- #### Other New Features and Improvements
- `scale_x_log2()`, `scale_y_log2()`
- New variables computed by `'count'` and `'count2d'` statistics: `'..sumprop..'`, `'..sumpct..'`.
See: [example notebook](https://nbviewer.jupyter.org/github/JetBrains/lets-plot/blob/master/docs/f-23f/new_stat_count_vars.ipynb).
- Support using dictionaries for breaks/labels/values customization in `scale_xxx()` functions.
See: [example notebook](https://nbviewer.jupyter.org/github/JetBrains/lets-plot/blob/master/docs/f-23f/scale_params_with_dict.ipynb).
- The `lablim` parameter in `scale_xxx()` functions.
See: [example notebook](https://nbviewer.jupyter.org/github/JetBrains/lets-plot/blob/master/docs/f-23f/scale_lablim.ipynb).
- `label_text` parameter in `theme()` for annotation text settings.
See: [example notebook](https://nbviewer.org/github/JetBrains/lets-plot/blob/master/docs/f-23f/theme_label_text.ipynb).
- NumberFormat: new flag `~` to trim trailing zeros.
## Change Log
See [CHANGELOG.md](https://github.com/JetBrains/lets-plot/blob/master/CHANGELOG.md) for other changes and fixes.
## Code of Conduct
This project and the corresponding community are governed by the
[JetBrains Open Source and Community Code of Conduct](https://confluence.jetbrains.com/display/ALL/JetBrains+Open+Source+and+Community+Code+of+Conduct).
Please make sure you read it.
## License
Code and documentation released under the [MIT license](https://github.com/JetBrains/lets-plot/blob/master/LICENSE).
Copyright © 2019-2023, JetBrains s.r.o.