Lets-Plot Kotlin API is largely based on the API
provided by
ggplot2 package well-known to data scientists who use R.
To learn more about the Grammar of Graphics,
we recommend an excellent book called
“ggplot2: Elegant Graphics for Data Analysis”.
This will be a good prerequisite for further exploration of the Lets-Plot library.
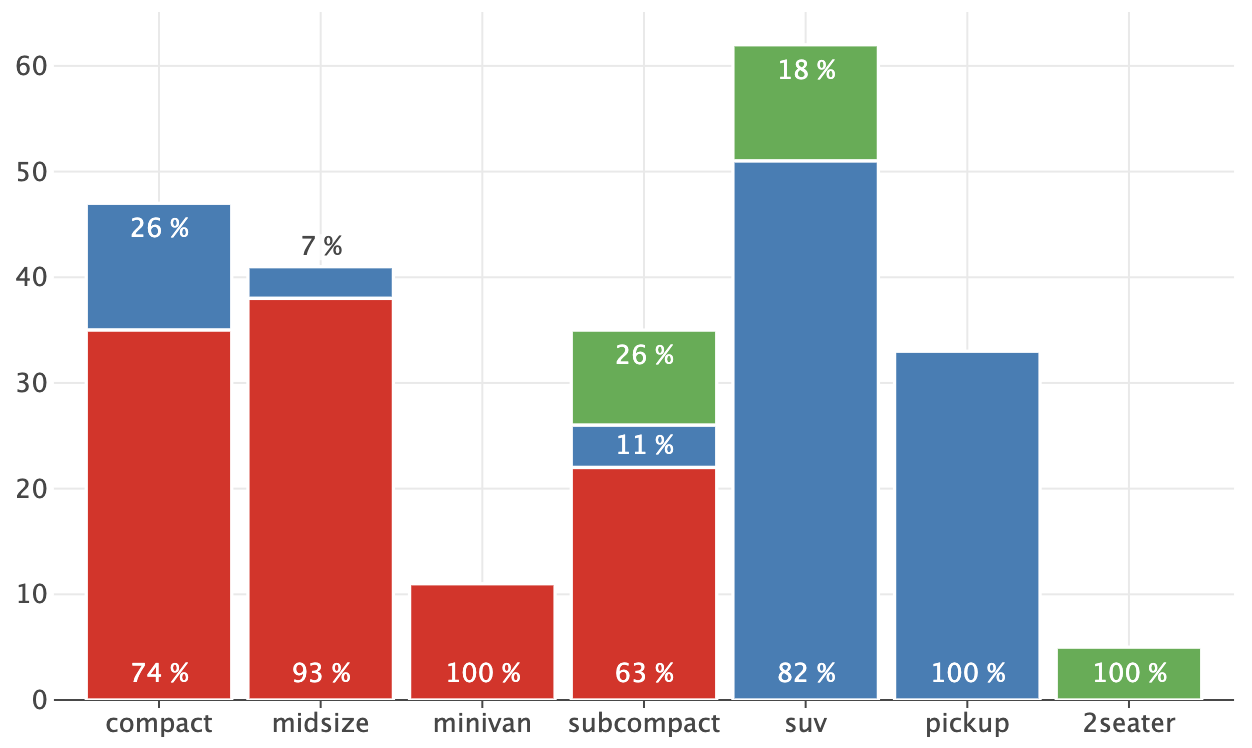 See: [example notebook](https://nbviewer.org/github/JetBrains/lets-plot-kotlin/blob/master/docs/examples/jupyter-notebooks/f-4.5.0/bar_annotations.ipynb).
- #### Common Theme for Subplots
See: [example notebook](https://nbviewer.org/github/JetBrains/lets-plot-kotlin/blob/master/docs/examples/jupyter-notebooks/f-4.5.0/bar_annotations.ipynb).
- #### Common Theme for Subplots
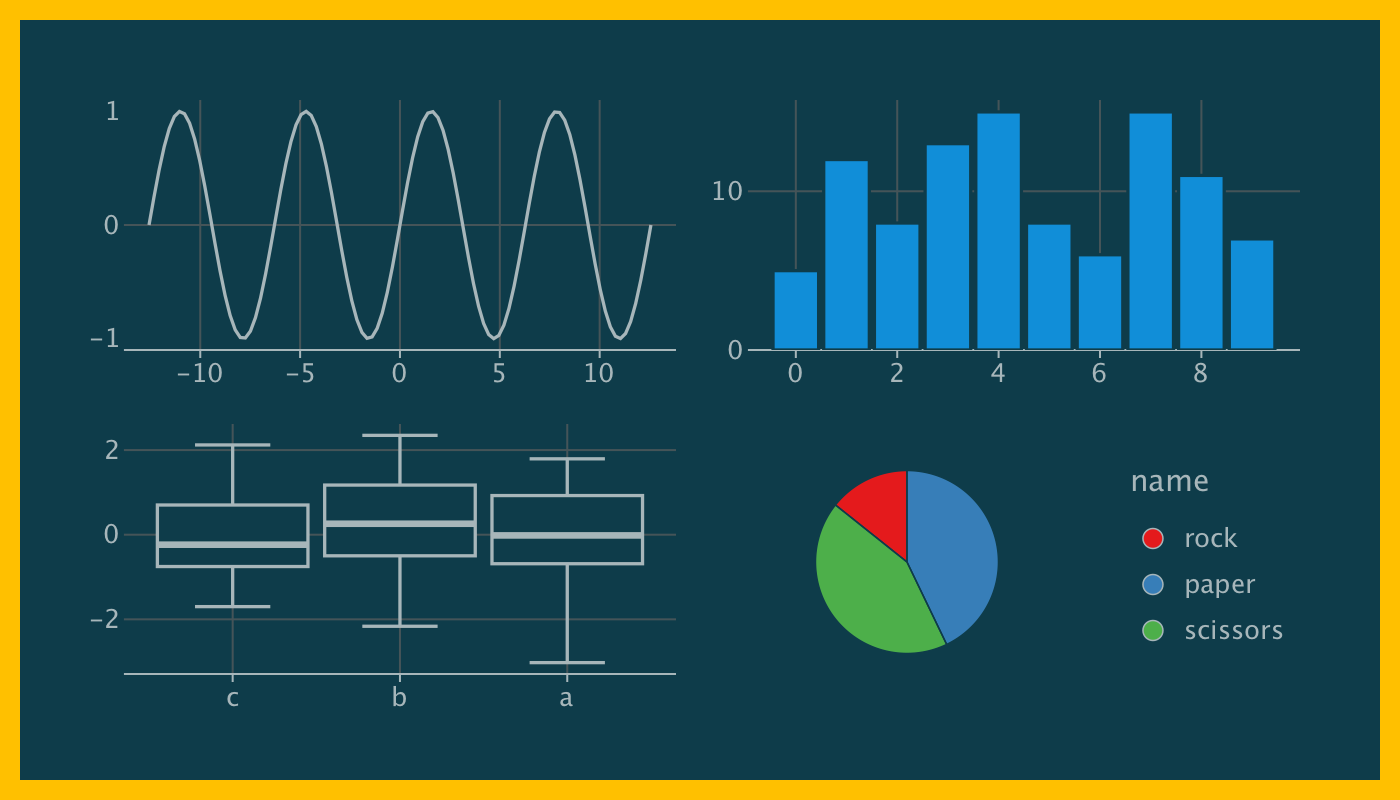 See: [example notebook](https://nbviewer.org/github/JetBrains/lets-plot-kotlin/blob/master/docs/examples/jupyter-notebooks/f-4.5.0/gggrid_theme.ipynb).
- #### `HCL` and `CIELAB` Color Space for Hue Color Scale and Gradient Color Scales
See: [example notebook](https://nbviewer.org/github/JetBrains/lets-plot-kotlin/blob/master/docs/examples/jupyter-notebooks/f-4.5.0/gggrid_theme.ipynb).
- #### `HCL` and `CIELAB` Color Space for Hue Color Scale and Gradient Color Scales
 See: [example notebook](https://nbviewer.org/github/JetBrains/lets-plot-kotlin/blob/master/docs/examples/jupyter-notebooks/f-4.5.0/color_space_update.ipynb).
- #### Scale Transformations: `'log2'` and `'symlog'`
See: [example notebook](https://nbviewer.org/github/JetBrains/lets-plot-kotlin/blob/master/docs/examples/jupyter-notebooks/f-4.5.0/new_scale_transformations.ipynb).
- #### Plot Margins
See: [example notebook](https://nbviewer.org/github/JetBrains/lets-plot-kotlin/blob/master/docs/examples/jupyter-notebooks/f-4.4.4/theme_plot_margin.ipynb).
- #### Dual Orientation in Geometries:
- `geom_linerange()`
- `geom_pointrange()`
- `geom_errorbar()`
- `geom_crossbar()`
- `geom_ribbon()`
See: [example notebook](https://nbviewer.org/github/JetBrains/lets-plot-kotlin/blob/master/docs/examples/jupyter-notebooks/f-4.4.4/horizontal_geoms.ipynb).
See: [example notebook](https://nbviewer.org/github/JetBrains/lets-plot-kotlin/blob/master/docs/examples/jupyter-notebooks/f-4.5.0/color_space_update.ipynb).
- #### Scale Transformations: `'log2'` and `'symlog'`
See: [example notebook](https://nbviewer.org/github/JetBrains/lets-plot-kotlin/blob/master/docs/examples/jupyter-notebooks/f-4.5.0/new_scale_transformations.ipynb).
- #### Plot Margins
See: [example notebook](https://nbviewer.org/github/JetBrains/lets-plot-kotlin/blob/master/docs/examples/jupyter-notebooks/f-4.4.4/theme_plot_margin.ipynb).
- #### Dual Orientation in Geometries:
- `geom_linerange()`
- `geom_pointrange()`
- `geom_errorbar()`
- `geom_crossbar()`
- `geom_ribbon()`
See: [example notebook](https://nbviewer.org/github/JetBrains/lets-plot-kotlin/blob/master/docs/examples/jupyter-notebooks/f-4.4.4/horizontal_geoms.ipynb).