# vtkplotter
**Repository Path**: jumboj/vtkplotter
## Basic Information
- **Project Name**: vtkplotter
- **Description**: A python class for scientific visualization of 3D objects with VTK
- **Primary Language**: Unknown
- **License**: MIT
- **Default Branch**: master
- **Homepage**: None
- **GVP Project**: No
## Statistics
- **Stars**: 0
- **Forks**: 0
- **Created**: 2020-06-02
- **Last Updated**: 2024-06-01
## Categories & Tags
**Categories**: Uncategorized
**Tags**: None
## README

[](https://app.codacy.com/app/marcomusy/vtkplotter?utm_source=github.com&utm_medium=referral&utm_content=marcomusy/vtkplotter&utm_campaign=Badge_Grade_Dashboard)
[](https://pepy.tech/project/vtkplotter)
[](https://en.wikipedia.org/wiki/MIT_License)
[](https://anaconda.org/conda-forge/vtkplotter)
[](https://repology.org/project/vtkplotter/versions)
[](https://doi.org/10.5281/zenodo.2561402)
[](https://circleci.com/gh/marcomusy/vtkplotter)
A lightweight pure python module for scientific analysis and visualization of 3D objects
and *point clouds* based on [VTK](https://www.vtk.org/) and [numpy](http://www.numpy.org/).
[](https://vtkplotter.embl.es/examples/geo_scene.html)
*(click on the picture to open a 3D viewer)*
## ✨ Philosophy
Inspired by the [vpython](https://vpython.org/) *manifesto* "3D programming for ordinary mortals",
*vtkplotter* makes it easy to work wth three-dimensional objects, create displays and animations
in just a few lines of code, even for those with less programming experience.
## 🎯 Table of Contents
* [Installation](https://github.com/marcomusy/vtkplotter#-installation)
* [Documentation](https://github.com/marcomusy/vtkplotter#-documentation)
* [Features](https://github.com/marcomusy/vtkplotter#-features)
* [Command Line Interface](https://github.com/marcomusy/vtkplotter#command-line-interface)
* [Examples Gallery](https://github.com/marcomusy/vtkplotter#-examples)
* [References](https://github.com/marcomusy/vtkplotter#-references)
## 💾 Installation
Use [pip](https://projects.raspberrypi.org/en/projects/using-pip-on-windows) to install:
```bash
pip install -U vtkplotter
```
or use [conda](https://anaconda.org/conda-forge/vtkplotter) to install from the conda-forge channel:
```bash
conda install -c conda-forge vtkplotter
```
or on Ubuntu OS:
```bash
sudo apt install python3-vtkplotter
```
*Windows-10 users* can place this file
[vtkplotter.bat](https://github.com/marcomusy/vtkplotter/blob/master/vtkplotter.bat)
on the desktop to *drag&drop* files to visualize.
(Need to edit the path of the local python installation).
## 📙 Documentation
Automatically generated documentation can be found [**here**](https://vtkplotter.embl.es).
📌 **Need help?** Have any question, or wish to suggest or ask for a missing feature?
Do not hesitate to open a [**issue**](https://github.com/marcomusy/vtkplotter/issues)
or send an [email](mailto:marco.musy@embl.es).
## 🎨 Features
Intuitive and straightforward API which can be combined with VTK seamlessly
in a program, whilst mantaining access to the full range of VTK native classes.
It includes a **[large set of working examples](https://github.com/marcomusy/vtkplotter/tree/master/vtkplotter/examples)**
for a wide range of functionalities:
working with polygonal meshes and point clouds *[click triangle to expand]*
- Import meshes from VTK format, STL, Wavefront OBJ, 3DS, Dolfin-XML, Neutral, GMSH, OFF, PCD (PointCloud),
- Export meshes as ASCII or binary to VTK, STL, OBJ, PLY ... formats.
- Analysis tools like Moving Least Squares, mesh morphing and more..
- Tools to visualize and edit meshes (cutting a mesh with another mesh, slicing, normalizing, moving vertex positions, etc..).
- Split mesh based on surface connectivity. Extract the largest connected area.
- Calculate areas, volumes, center of mass, average sizes etc.
- Calculate vertex and face normals, curvatures, feature edges. Fill mesh holes.
- Subdivide faces of a mesh, increasing the number of vertex points. Mesh simplification.
- Coloring and thresholding of meshes based on associated scalar or vectorial data.
- Point-surface operations: find nearest points, determine if a point lies inside or outside of a mesh.
- Create primitive shapes: spheres, arrows, cubes, torus, ellipsoids...
- Generate glyphs (associate a mesh to every vertex of a source mesh).
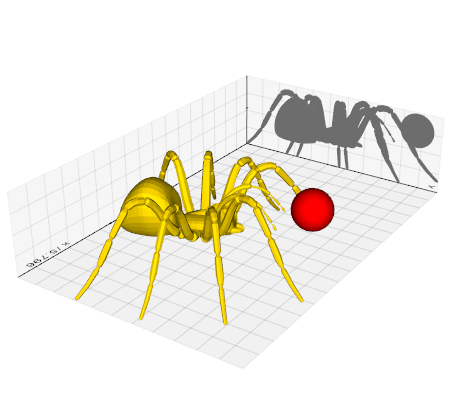
- Create animations easily by just setting the position of the displayed objects in the 3D scene. Add trailing lines and shadows to moving objects is supported.
- Straightforward support for multiple sync-ed or independent renderers in the same window.
- Registration (alignment) of meshes with different techniques.
- Mesh smoothing.
- Delaunay triangulation in 2D and 3D.
- Generate meshes by joining nearby lines in space.
- Find the closest path from one point to another, travelling along the edges of a mesh.
- Find the intersection of a mesh with lines, planes or other meshes.
- Interpolate scalar and vectorial fields with Radial Basis Functions and Thin Plate Splines.
- Add sliders and buttons to interact with the scene and the individual objects.
- Visualization of tensors.
- Analysis of Point Clouds:
- Moving Least Squares smoothing of 2D, 3D and 4D clouds
- Fit lines, planes, spheres and ellipses in space
- Identify outliers in a distribution of points
- Decimate a cloud to a uniform distribution.
working with volumetric data, and tetrahedral meshes
- Import data from VTK format volumetric TIFF stacks, DICOM, SLC, MHD and more
- Import 2D images as PNG, JPEG, BMP
- Isosurfacing of volumes
- Composite and maximum projection volumetric rendering
- Generate volumetric signed-distance data from an input surface mesh
- Probe a volume with lines and planes
- Generate stream-lines and stream-tubes from vectorial fields
- Slice and crop volumes
- Support for other volumetric structures (structured and grid data)
plotting and histogramming
- Fully customizable axis styles
- 'donut' plots and pie charts
- Scatter plots in 2D and 3D
- Surface function plotting
- 1D customizable histograms
- 2D hexagonal histograms
- Polar plots, spherical plots and histogramming
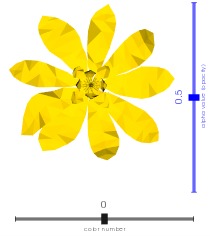
- Draw latex-formatted formulas in the rendering window.
- Quiver plots
- Stream line plots
- Point markers analogous to matplotlib
Moreover:
- Integration with the *Qt5* framework.
- Examples using [SHTools](https://shtools.oca.eu/shtools) package for *spherical harmonics* expansion of a mesh shape.
- Support for [FEniCS/Dolfin](https://fenicsproject.org/) platform for visualization of finite-element calculations.
- Interoperability with the [trimesh](https://trimsh.org/) library.
- Export a 3D scene and embed it into a [web page](https://vtkplotter.embl.es/examples/fenics_elasticity.html).
- Embed the 3D rendering in a *jupyter* notebook with [K3D](https://github.com/K3D-tools/K3D-jupyter) (can export an interactive 3D-snapshot page [here](https://vtkplotter.embl.es/examples/geo_scene.html)).
## ⌨ Command Line Interface
Visualize a polygonal mesh from a terminal window with:
```bash
vtkplotter mesh.obj
# valid formats: [vtk,vtu,vts,vtp,vtm,ply,obj,stl,3ds,dolfin-xml,neutral,gmsh,
# pcd,xyz,txt,byu,tif,off,slc,vti,mhd,dcm,dem,nrrd,nii,bmp,png,jpg]
```
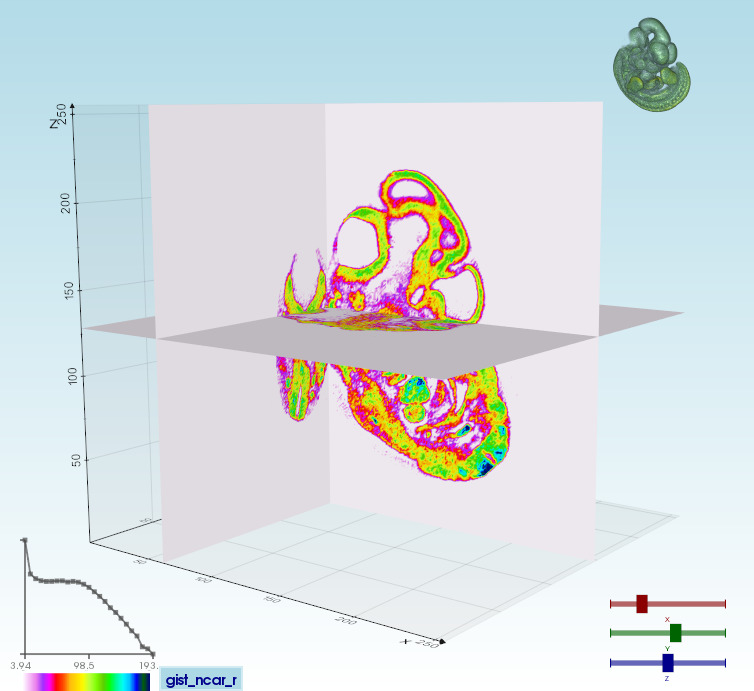
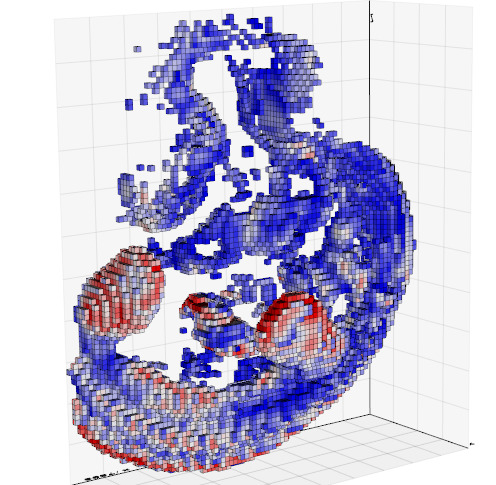
Volumetric files (_mhd, vti, slc, tiff, DICOM etc.._) can be visualized with options:
|Slice a volume in the 3 planes:
`vtkplotter --slicer embryo.slc`| Ray-casting rendering:
`-g embryo.slc`| 2D slice:
`--slicer2d`| Colorize voxels:
`--lego`|
|:--------|:-----|:--------|:-----|
| || | |
To visualize multiple files or files time-sequences try `-n` or `-s` options. Use `-h` for the complete list of options.
A GUI is also available (mainly useful to Windows 10 users).

## 🐾 Examples
**More than 300 working examples can be found in directories** _(scroll down to see thumbnails):_
[**examples/basic**](https://github.com/marcomusy/vtkplotter/blob/master/vtkplotter/examples/basic)
[**examples/advanced**](https://github.com/marcomusy/vtkplotter/blob/master/vtkplotter/examples/advanced)
[**examples/volumetric**](https://github.com/marcomusy/vtkplotter/blob/master/vtkplotter/examples/volumetric)
[**examples/tetmesh**](https://github.com/marcomusy/vtkplotter/blob/master/vtkplotter/examples/tetmesh)
[**examples/simulations**](https://github.com/marcomusy/vtkplotter/blob/master/vtkplotter/examples/simulations)
[**examples/pyplot**](https://github.com/marcomusy/vtkplotter/blob/master/vtkplotter/examples/pyplot)
[**examples/other**](https://github.com/marcomusy/vtkplotter/blob/master/vtkplotter/examples/other)
[**examples/other/dolfin**](https://github.com/marcomusy/vtkplotter/blob/master/vtkplotter/examples/other/dolfin)
[**examples/other/trimesh**](https://github.com/marcomusy/vtkplotter/blob/master/vtkplotter/examples/other/trimesh)
[**examples/notebooks**](https://github.com/marcomusy/vtkplotter/blob/master/notebooks)
| | |
|:--------|:-----|
|Apply a *Moving Least Squares* algorithm to obtain a smooth surface from a to a large cloud of scattered points in space ([script](https://github.com/marcomusy/vtkplotter/blob/master/vtkplotter/examples/advanced/moving_least_squares2D.py))
 | 
Create a simple 3D animation in exactly 10 lines of code ([script](https://github.com/marcomusy/vtkplotter/blob/master/vtkplotter/examples/simulations/airplanes.py)).
Trails and shadows can be added to moving objects easily.|
| | |
| Simulation of a gyroscope hanging from a spring ([script](https://github.com/marcomusy/vtkplotter/blob/master/vtkplotter/examples/simulations/gyroscope1.py)).
 | 
Quantum-tunnelling effect integrating the Schroedinger equation with 4th order Runge-Kutta method. The animation shows the evolution of a particle in a box hitting a sinusoidal potential barrier. ([script](https://github.com/marcomusy/vtkplotter/blob/master/vtkplotter/examples/simulations/tunnelling2.py)) |
| | |
|Turing system of reaction-diffusion between two molecules ([script](https://github.com/marcomusy/vtkplotter/blob/master/vtkplotter/examples/simulations/grayscott.py))
 | 
Support for the [FEniCS/Dolfin](https://fenicsproject.org/) platform for visualization of PDE and finite element solutions ([see here](https://github.com/marcomusy/vtkplotter/blob/master/vtkplotter/examples/other/dolfin)) |
### Random Gallery of Examples
Run any of the built-in examples from command line, e.g.:
> `vtkplotter -ir covid19`
| | | | |
|:---:|:---:|:---:|:---:|
|
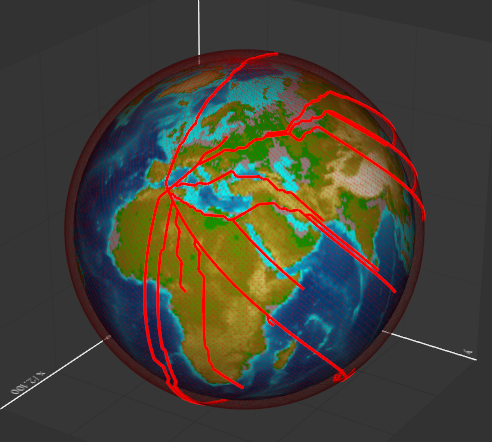
`geological`|
`multirender`| 
`cartoony`|
`streamlines4`|
| 
`covid19`| 
`lineage_graph` |
`silhouette1` | 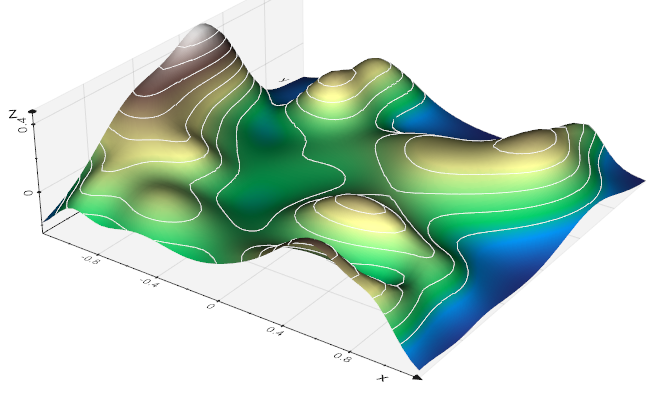
`isolines`|
| 
`gyroscope2` | 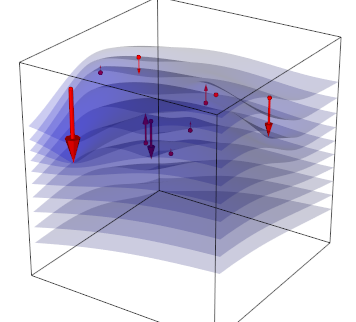
`thinplate_grid` | 
`trail` | 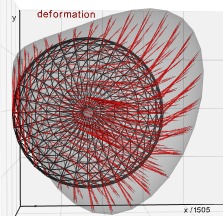
`quadratic_morphing` |
| 
`shrink` | 
`mesh_custom` | 
`spring` | 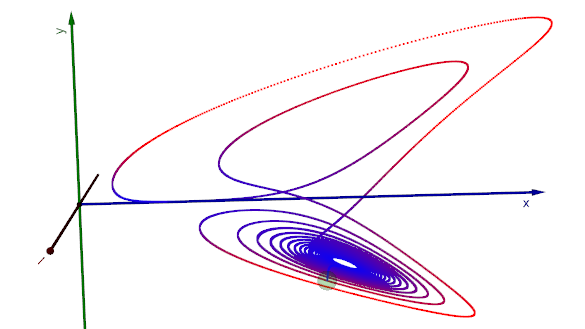
`lorentz` |
| 
`sliders` | 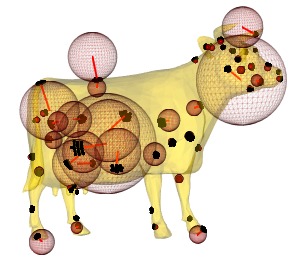
`fitspheres1` | 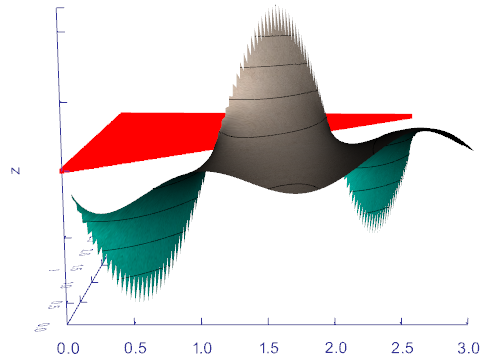
`plot4_fxy` | 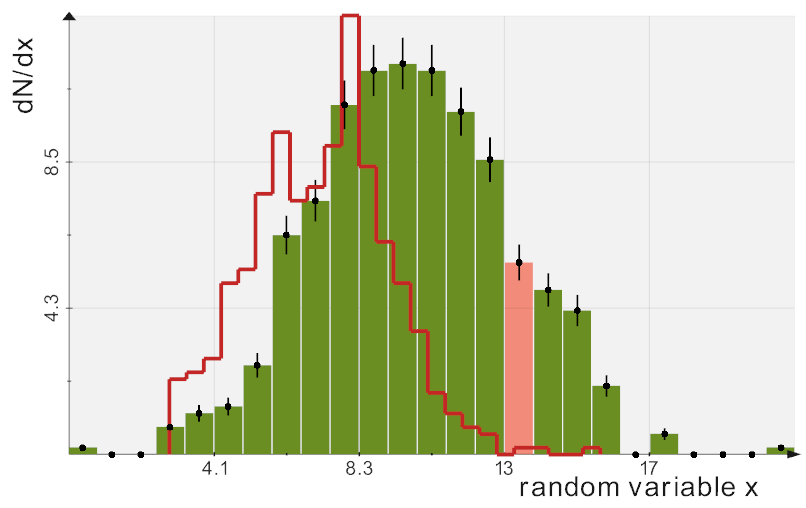
`histo_1D` |
| 
`plot2_errband` | 
`histo_2D`| 
`histo_hexagonal` | 
`plot5_spheric` |
| 
`boolean` | 
`brownian2D` | 
`gas` | 
`self_org_maps2d` |
| 
`geodesic` | 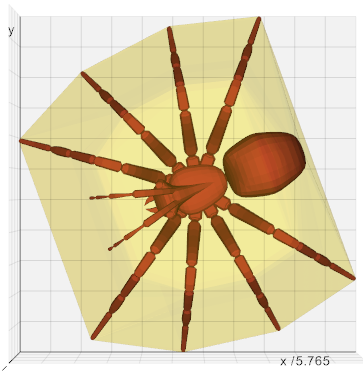
`convexHull` | 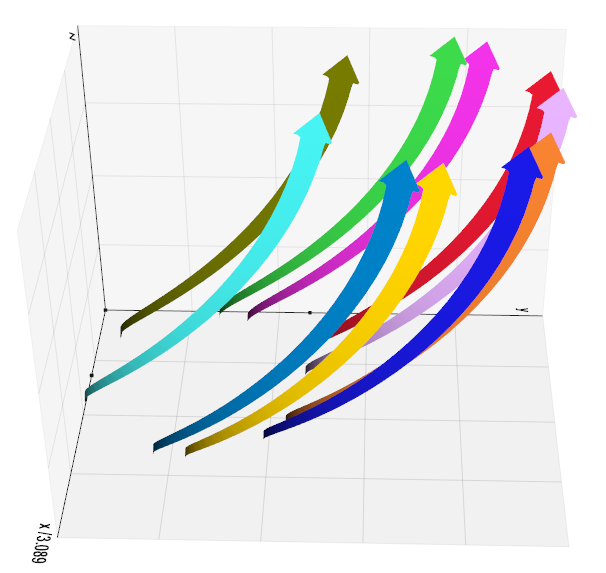
`flatarrow` | 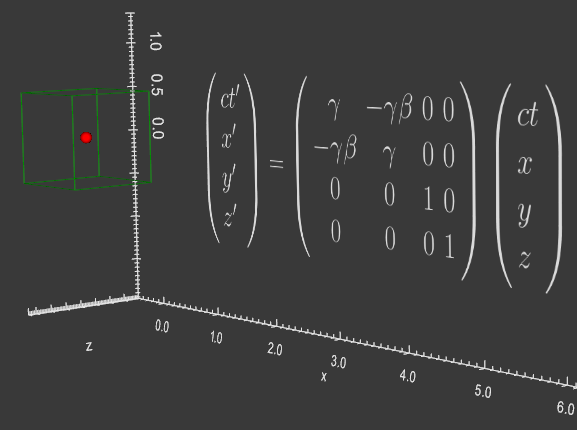
`latex` |
| 
`legosurface`| 
`streamlines2` | 
`office.py` | 
`value-iteration` |
| 
`shadow`| 
`multiple_pend` | 
`interpolateVolume` | 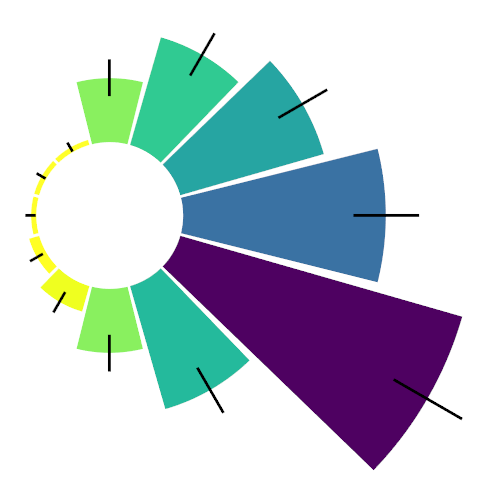
`histo_polar` |
| 
`plot7_stream`| 
`histo_violin` | 
`plot3_pip` | 
`histo_spheric` |
| 
`read_vts` | 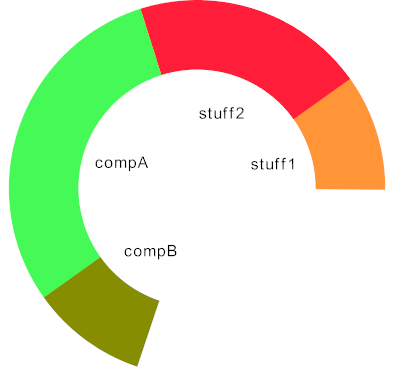
`donut` | 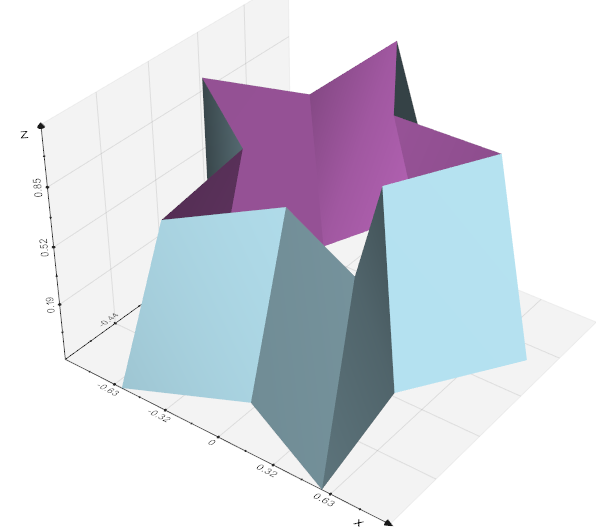
`extrude` | 
`plot1_errbars` |
||  |  | |
| 
`particle_simulator`| 
`heatconv` |
`elastodynamics` | 
`stokes_lshape`|
## 📜 References
- M. Musy, G. Dalmasso, J. Sharpe and N. Sime, "`vtkplotter`*: plotting in FEniCS with python*", ([link](https://github.com/marcomusy/vtkplotter/blob/master/docs/fenics_poster.pdf)).
Poster at the [FEniCS'2019](https://fenicsproject.org/fenics19/) Conference,
Carnegie Institution for Science Department of Terrestrial Magnetism, Washington DC, June 2019.
- G. Dalmasso, *"Evolution in space and time of 3D volumetric images"*. Talk at the Conference for [Image-based Modeling and Simulation of Morphogenesis](https://www.pks.mpg.de/imsm19/).
Max Planck Institute for the Physics of Complex Systems, Dresden, Germany, March 2019.
Scientific publications using `vtkplotter` so far:
1. X. Diego _et al._:
*"Key features of Turing systems are determined purely by network topology"*,
[Physical Review X, 20 June 2018](https://journals.aps.org/prx/abstract/10.1103/PhysRevX.8.021071).
2. M. Musy, K. Flaherty _et al._:
*"A Quantitative Method for Staging Mouse Limb Embryos based on Limb Morphometry"*,
Development, 5 April 2018, [doi: 10.1242/dev.154856](http://dev.biologists.org/content/145/7/dev154856).
3. G. Dalmasso *et al.*, *"Evolution in space and time of 3D volumetric images"*, in preparation.
4. F. Claudi, A. L. Tyson, T. Branco, *"Brainrender. A python based software for visualisation of neuroanatomical and morphological data."*
bioRxiv 2020.02.23.961748; doi: https://doi.org/10.1101/2020.02.23.961748
**Have you found this software useful for your research? Please cite it as:**
M. Musy _et al._
"`vtkplotter`*, a python module for scientific visualization and analysis of 3D objects
and point clouds based on VTK (Visualization Toolkit)*",
Zenodo, 10 February 2019, [doi: 10.5281/zenodo.2561402](http://doi.org/10.5281/zenodo.2561402).
[](https://www.embl.es)