# php-fpm_exporter
**Repository Path**: lhtzbj12/php-fpm_exporter
## Basic Information
- **Project Name**: php-fpm_exporter
- **Description**: No description available
- **Primary Language**: Unknown
- **License**: Apache-2.0
- **Default Branch**: master
- **Homepage**: None
- **GVP Project**: No
## Statistics
- **Stars**: 0
- **Forks**: 0
- **Created**: 2021-04-30
- **Last Updated**: 2021-04-30
## Categories & Tags
**Categories**: Uncategorized
**Tags**: None
## README
# php-fpm_exporter

[](https://goreportcard.com/report/github.com/hipages/php-fpm_exporter)
[](https://godoc.org/github.com/hipages/php-fpm_exporter)
[](https://sonarcloud.io/dashboard?id=hipages_php-fpm_exporter)
[](https://hub.docker.com/r/hipages/php-fpm_exporter/)
[](http://isitmaintained.com/project/hipages/php-fpm_exporter "Average time to resolve an issue")
[](http://isitmaintained.com/project/hipages/php-fpm_exporter "Percentage of issues still open")
[](https://www.codetriage.com/hipages/php-fpm_exporter)
[](#contributors)
A [prometheus](https://prometheus.io/) exporter for PHP-FPM.
The exporter connects directly to PHP-FPM and exports the metrics via HTTP.
A webserver such as NGINX or Apache is **NOT** needed!
## Table of Contents
- [Features](#features)
- [Usage](#usage)
* [Options and defaults](#options-and-defaults)
* [Why `--phpfpm.fix-process-count`?](#why---phpfpmfix-process-count)
* [CLI Examples](#cli-examples)
* [Docker Examples](#docker-examples)
* [Kubernetes Example](#kubernetes-example)
- [Metrics collected](#metrics-collected)
- [Grafana Dasbhoard for Kubernetes](#grafana-dasbhoard-for-kubernetes)
- [FAQ](#faq)
- [Development](#development)
* [E2E Tests](#e2e-tests)
- [Contributing](#contributing)
- [Contributors](#contributors)
- [Alternatives](#alternatives)
## Features
* Export single or multiple pools
* Export to CLI as text or JSON
* Connects directly to PHP-FPM via TCP or Socket
* Maps environment variables to CLI options
* Fix for PHP-FPM metrics oddities
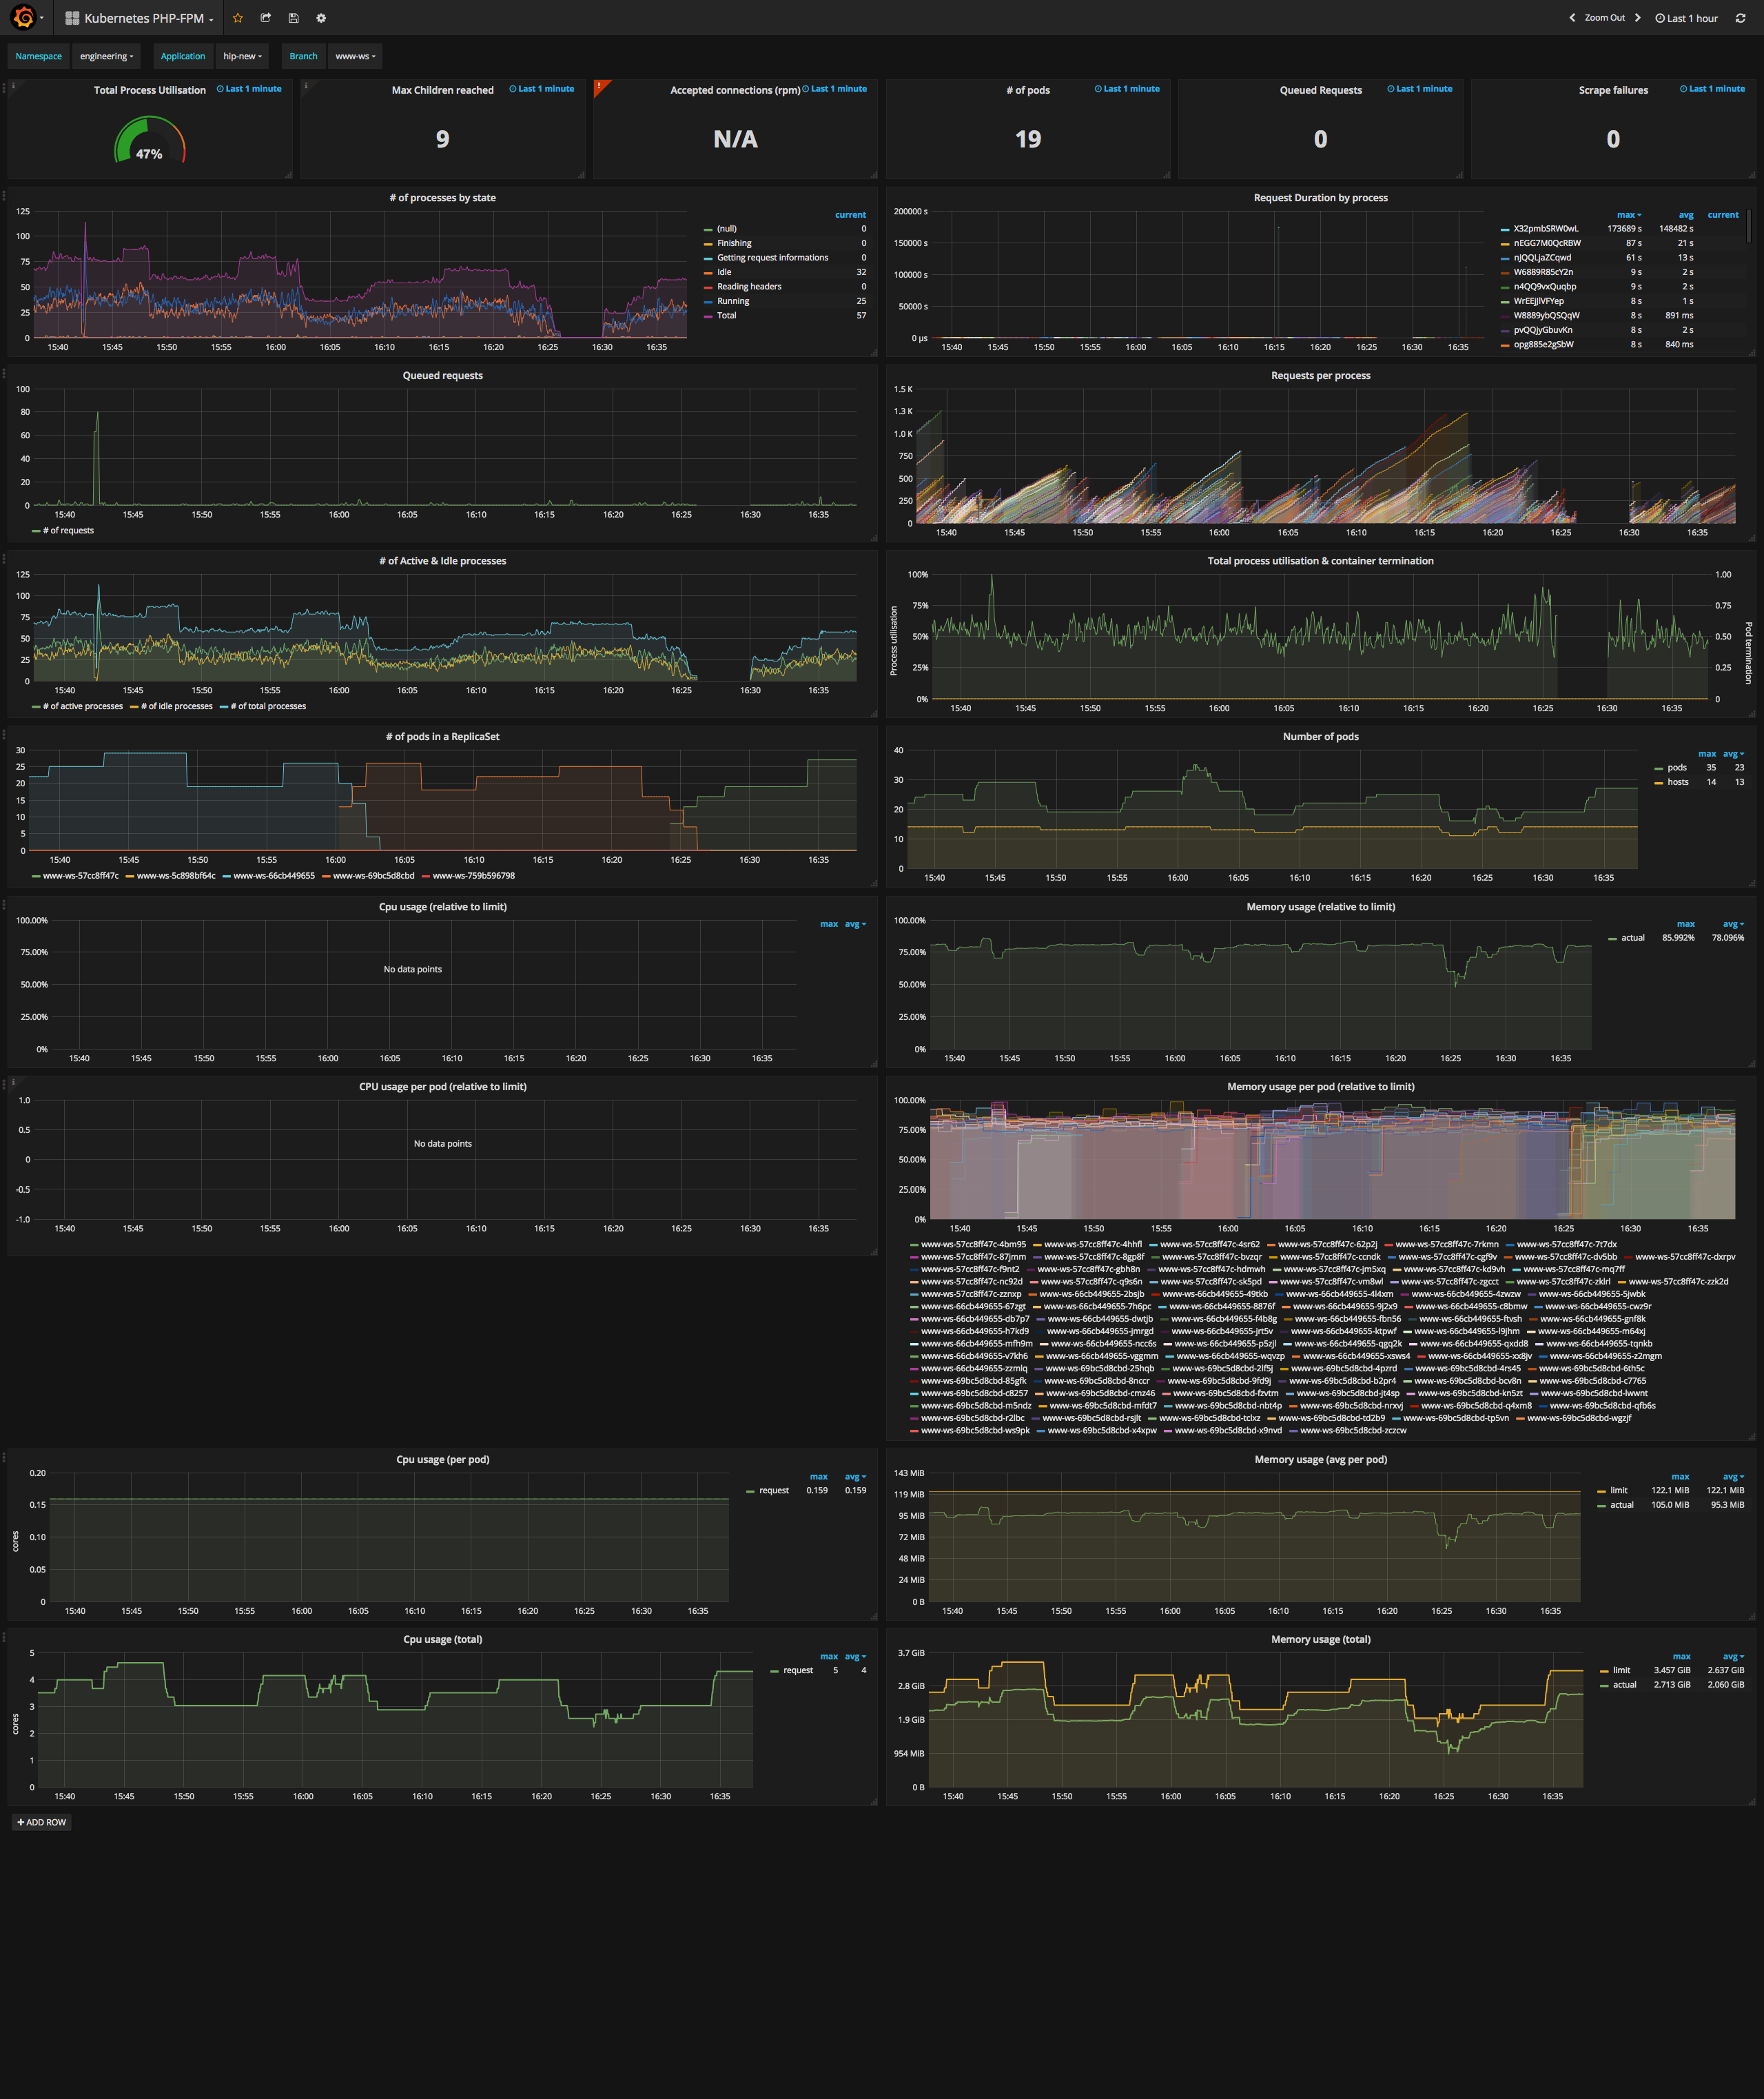
* [Grafana Dashboard](https://grafana.com/dashboards/4912) for Kubernetes
## Usage
`php-fpm_exporter` is released as [binary](https://github.com/hipages/php-fpm_exporter/releases) and [docker](https://hub.docker.com/r/hipages/php-fpm_exporter/) image.
It uses sensible defaults which usually avoids the need to use command parameters or environment variables.
`php-fpm_exporter` supports 2 commands, `get` and `server`.
The `get` command allows to retrieve information from PHP-FPM without running as a server and exposing an endpoint.
The `server` command runs the server required for prometheus to retrieve the statistics.
### Options and defaults
| Option | Description | Environment variable | Default value |
|------------------------|-------------------------------------------------------|------------------------------|-----------------|
| `--web.listen-address` | Address on which to expose metrics and web interface. | `PHP_FPM_WEB_LISTEN_ADDRESS` | [`:9253`](https://github.com/prometheus/prometheus/wiki/Default-port-allocations) |
| `--web.telemetry-path` | Path under which to expose metrics. | `PHP_FPM_WEB_TELEMETRY_PATH` | `/metrics` |
| `--web.disable-exporter-metrics` | Exclude metrics about the exporter itself (promhttp_*, process_*, go_*). | `PHP_FPM_WEB_DISABLE_EXPORTER_METRICS` | `false` |
| `--web.disable-process-state-metrics` | Exclude metrics about phpfpm process state. `--phpfpm.fix-process-count` will be set to `false` if the flag is set to `ture`. | `PHP_FPM_WEB_DISABLE_PROCESS_STATE_METRICS` | `false` |
| `--phpfpm.scrape-uri` | FastCGI address, e.g. unix:///tmp/php.sock;/status or tcp://127.0.0.1:9000/status | `PHP_FPM_SCRAPE_URI` | `tcp://127.0.0.1:9000/status` |
| `--phpfpm.fix-process-count` | Enable to calculate process numbers via php-fpm_exporter since PHP-FPM sporadically reports wrong active/idle/total process numbers. | `PHP_FPM_FIX_PROCESS_COUNT`| `false` |
| `--log.level` | Only log messages with the given severity or above. Valid levels: [debug, info, warn, error, fatal] (default "error") | `PHP_FPM_LOG_LEVEL` | info |
### Why `--phpfpm.fix-process-count`?
`php-fpm_exporter` implements an option to "fix" the reported metrics based on the provided processes list by PHP-FPM.
We have seen PHP-FPM provide metrics (e.g. active processes) which don't match reality.
Specially `active processes` being larger than `max_children` and the actual number of running processes on the host.
Looking briefly at the source code of PHP-FPM it appears a scoreboard is being kept and the values are increased/decreased once an action is executed.
The metric `active processes` is also an accumulation of multiple states (e.g. Reading headers, Getting request information, Running).
Which shouldn't matter and `active processes` should still be equal or lower to `max_children`.
`--phpfpm.fix-process-count` will emulate PHP-FPMs implementation including the accumulation of multiple states.
If you like to have a more granular reporting please use `phpfpm_process_state`.
* https://bugs.php.net/bug.php?id=76003
* https://stackoverflow.com/questions/48961556/can-active-processes-be-larger-than-max-children-for-php-fpm
### CLI Examples
* Retrieve information from PHP-FPM running on `127.0.0.1:9000` with status endpoint being `/status`
```
php-fpm_exporter get
```
* Retrieve information from PHP-FPM running on `127.0.0.1:9000` and `127.0.0.1:9001`
```
php-fpm_exporter get --phpfpm.scrape-uri tcp://127.0.0.1:9000/status,tcp://127.0.0.1:9001/status
```
* Run as server with 2 pools:
```
php-fpm_exporter server --phpfpm.scrape-uri tcp://127.0.0.1:9000/status,tcp://127.0.0.1:9001/status
```
* Run as server and enable process count fix via environment variable:
```
PHP_FPM_FIX_PROCESS_COUNT=1 go run main.go server --web.listen-address ":12345" --log.level=debug
```
### Docker Examples
* Run docker manually
```
docker pull hipages/php-fpm_exporter
docker run -it --rm -e PHP_FPM_SCRAPE_URI="tcp://127.0.0.1:9000/status,tcp://127.0.0.1:9001/status" hipages/php-fpm_exporter
```
* Run the docker-compose example
```
git clone git@github.com:hipages/php-fpm_exporter.git
cd php-fpm_exporter/test
docker-compose -p php-fpm_exporter up
```
You can now access the following links:
* Prometheus: http://127.0.0.1:9090/
* php-fpm_exporter metrics: http://127.0.0.1:9253/metrics
[](https://asciinema.org/a/1msR8nqAsFdHzROosUb7PiHvf)
### Kubernetes Example
TBD
## Metrics collected
```
# HELP phpfpm_accepted_connections The number of requests accepted by the pool.
# TYPE phpfpm_accepted_connections counter
# HELP phpfpm_active_processes The number of active processes.
# TYPE phpfpm_active_processes gauge
# HELP phpfpm_idle_processes The number of idle processes.
# TYPE phpfpm_idle_processes gauge
# HELP phpfpm_listen_queue The number of requests in the queue of pending connections.
# TYPE phpfpm_listen_queue gauge
# HELP phpfpm_listen_queue_length The size of the socket queue of pending connections.
# TYPE phpfpm_listen_queue_length gauge
# HELP phpfpm_max_active_processes The maximum number of active processes since FPM has started.
# TYPE phpfpm_max_active_processes counter
# HELP phpfpm_max_children_reached The number of times, the process limit has been reached, when pm tries to start more children (works only for pm 'dynamic' and 'ondemand').
# TYPE phpfpm_max_children_reached counter
# HELP phpfpm_max_listen_queue The maximum number of requests in the queue of pending connections since FPM has started.
# TYPE phpfpm_max_listen_queue counter
# HELP phpfpm_process_last_request_cpu The %cpu the last request consumed.
# TYPE phpfpm_process_last_request_cpu gauge
# HELP phpfpm_process_last_request_memory The max amount of memory the last request consumed.
# TYPE phpfpm_process_last_request_memory gauge
# HELP phpfpm_process_request_duration The duration in microseconds of the requests.
# TYPE phpfpm_process_request_duration gauge
# HELP phpfpm_process_requests The number of requests the process has served.
# TYPE phpfpm_process_requests counter
# HELP phpfpm_process_state The state of the process (Idle, Running, ...).
# TYPE phpfpm_process_state gauge
# HELP phpfpm_scrape_failures The number of failures scraping from PHP-FPM.
# TYPE phpfpm_scrape_failures counter
# HELP phpfpm_slow_requests The number of requests that exceeded your 'request_slowlog_timeout' value.
# TYPE phpfpm_slow_requests counter
# HELP phpfpm_start_since The number of seconds since FPM has started.
# TYPE phpfpm_start_since counter
# HELP phpfpm_total_processes The number of idle + active processes.
# TYPE phpfpm_total_processes gauge
# HELP phpfpm_up Could PHP-FPM be reached?
# TYPE phpfpm_up gauge
```
## Grafana Dasbhoard for Kubernetes
The Grafana dashboard can be found [here](https://grafana.com/dashboards/4912).
 ## FAQ
* **How to update "Metrics collected"?**
Copy&paste the output from:
```
curl http://127.0.0.1:12345/metrics | grep phpfpm | grep "#"
```
## Development
### E2E Tests
The E2E tests are based on docker-compose and bats-core. Install the required components, e.g. via brew on MacOS:
```bash
brew tap kaos/shell
brew install docker-compose bats-core kaos/shell/bats-assert kaos/shell/bats-support
```
After the components are installed run the E2E tests:
```bash
make tests-e2e
```
## Contributing
Contributions are greatly appreciated.
The maintainers actively manage the issues list, and try to highlight issues suitable for newcomers.
The project follows the typical GitHub pull request model.
See " [How to Contribute to Open Source](https://opensource.guide/how-to-contribute/) " for more details.
Before starting any work, please either comment on an existing issue, or file a new one.
## Contributors
Thanks goes to these wonderful people ([emoji key](https://github.com/all-contributors/all-contributors#emoji-key)):
This project follows the [all-contributors](https://github.com/all-contributors/all-contributors) specification. Contributions of any kind welcome!
## Alternatives
* [bakins/php-fpm-exporter](https://github.com/bakins/php-fpm-exporter)
* [peakgames/php-fpm-prometheus](https://github.com/peakgames/php-fpm-prometheus)
* [craigmj/phpfpm_exporter](https://github.com/craigmj/phpfpm_exporter)
## FAQ
* **How to update "Metrics collected"?**
Copy&paste the output from:
```
curl http://127.0.0.1:12345/metrics | grep phpfpm | grep "#"
```
## Development
### E2E Tests
The E2E tests are based on docker-compose and bats-core. Install the required components, e.g. via brew on MacOS:
```bash
brew tap kaos/shell
brew install docker-compose bats-core kaos/shell/bats-assert kaos/shell/bats-support
```
After the components are installed run the E2E tests:
```bash
make tests-e2e
```
## Contributing
Contributions are greatly appreciated.
The maintainers actively manage the issues list, and try to highlight issues suitable for newcomers.
The project follows the typical GitHub pull request model.
See " [How to Contribute to Open Source](https://opensource.guide/how-to-contribute/) " for more details.
Before starting any work, please either comment on an existing issue, or file a new one.
## Contributors
Thanks goes to these wonderful people ([emoji key](https://github.com/all-contributors/all-contributors#emoji-key)):
This project follows the [all-contributors](https://github.com/all-contributors/all-contributors) specification. Contributions of any kind welcome!
## Alternatives
* [bakins/php-fpm-exporter](https://github.com/bakins/php-fpm-exporter)
* [peakgames/php-fpm-prometheus](https://github.com/peakgames/php-fpm-prometheus)
* [craigmj/phpfpm_exporter](https://github.com/craigmj/phpfpm_exporter)


