# Dex
**Repository Path**: li-changjian/Dex
## Basic Information
- **Project Name**: Dex
- **Description**: Dex : The Data Explorer -- A data visualization tool written in Java/Groovy/JavaFX capable of powerful ETL and publishing web visualizations.
- **Primary Language**: Unknown
- **License**: Apache-2.0
- **Default Branch**: master
- **Homepage**: None
- **GVP Project**: No
## Statistics
- **Stars**: 0
- **Forks**: 0
- **Created**: 2020-12-30
- **Last Updated**: 2020-12-30
## Categories & Tags
**Categories**: Uncategorized
**Tags**: None
## README
 # Dex
Dex : The data explorer is a powerful tool for data science. It is written in Groovy and Java on top of JavaFX and offers the ability to:
* Read in data from a variety of sources such files, programs and a variety of databases.
* Transform the data in a powerful ways.
* Apply powerful machine learning to the data via SMILE and R integration.
* Visualize the data in over 50 distinct ways.
* Output the data to a variety of databases and file formats.
* Extend Dex from within via templates and internal scripting. Save the extensions to reuse later.
## Other Resources
* [Main Site](http://dexvis.net)
* [Blog](http://dexvis.wordpress.com)
# Requirements
- Java 8
# Installation
There are 2 main ways to install Dex.
1. Install via Git by following the instructions below.
2. [Download a stable release](http://dexvis.net/doku.php?id=Download)
The packaged release tends to lag significantly behind the Git version.
## Via Git
### Download:
```bash
git clone https://github.com/PatMartin/Dex.git
```
### Run
```bash
cd Dex
java -jar Dex.jar
```
# Example Visualizations
The following are a small sample of the 50+ data visualizations Dex is capable of generating.
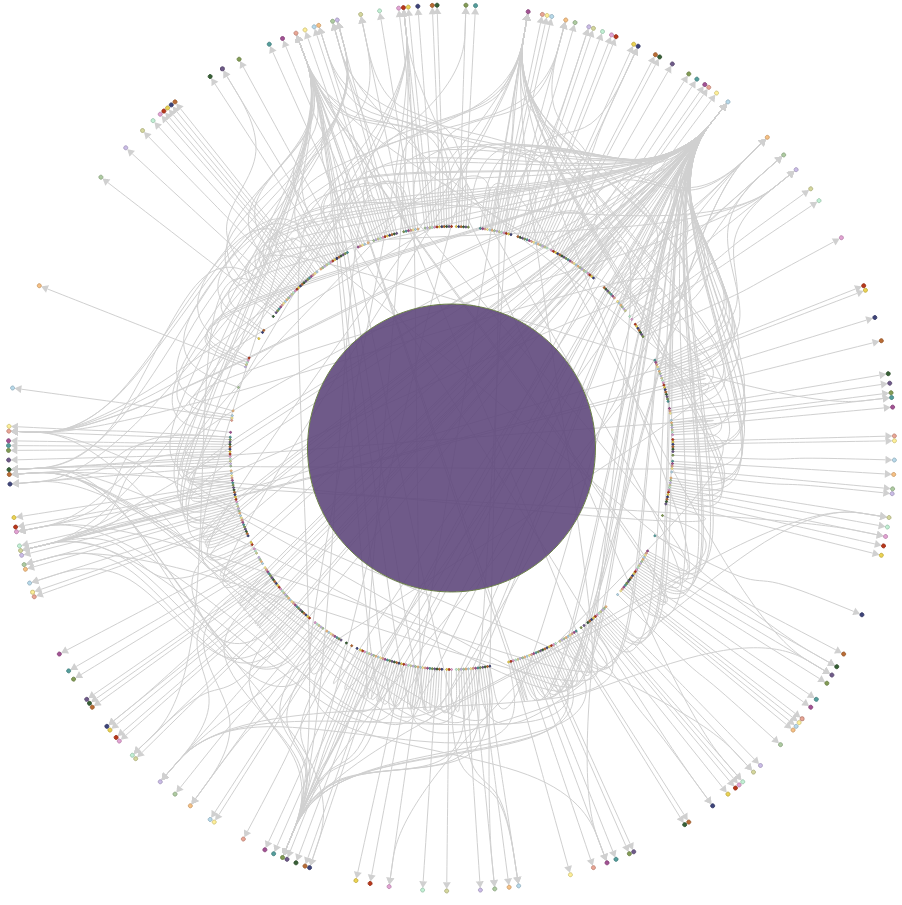
## Ring Network
This visualization was created with Dex to visualize the relationships between Dr Who villans and motivations.
# Dex
Dex : The data explorer is a powerful tool for data science. It is written in Groovy and Java on top of JavaFX and offers the ability to:
* Read in data from a variety of sources such files, programs and a variety of databases.
* Transform the data in a powerful ways.
* Apply powerful machine learning to the data via SMILE and R integration.
* Visualize the data in over 50 distinct ways.
* Output the data to a variety of databases and file formats.
* Extend Dex from within via templates and internal scripting. Save the extensions to reuse later.
## Other Resources
* [Main Site](http://dexvis.net)
* [Blog](http://dexvis.wordpress.com)
# Requirements
- Java 8
# Installation
There are 2 main ways to install Dex.
1. Install via Git by following the instructions below.
2. [Download a stable release](http://dexvis.net/doku.php?id=Download)
The packaged release tends to lag significantly behind the Git version.
## Via Git
### Download:
```bash
git clone https://github.com/PatMartin/Dex.git
```
### Run
```bash
cd Dex
java -jar Dex.jar
```
# Example Visualizations
The following are a small sample of the 50+ data visualizations Dex is capable of generating.
## Ring Network
This visualization was created with Dex to visualize the relationships between Dr Who villans and motivations.
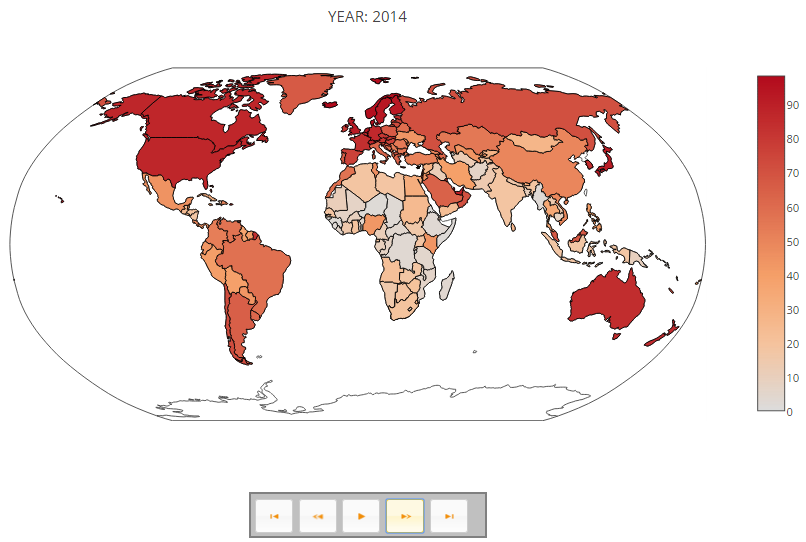
 ## Maps
This visualization was created with Dex to visualize internet use across the world over the past 20 years.
## Maps
This visualization was created with Dex to visualize internet use across the world over the past 20 years.
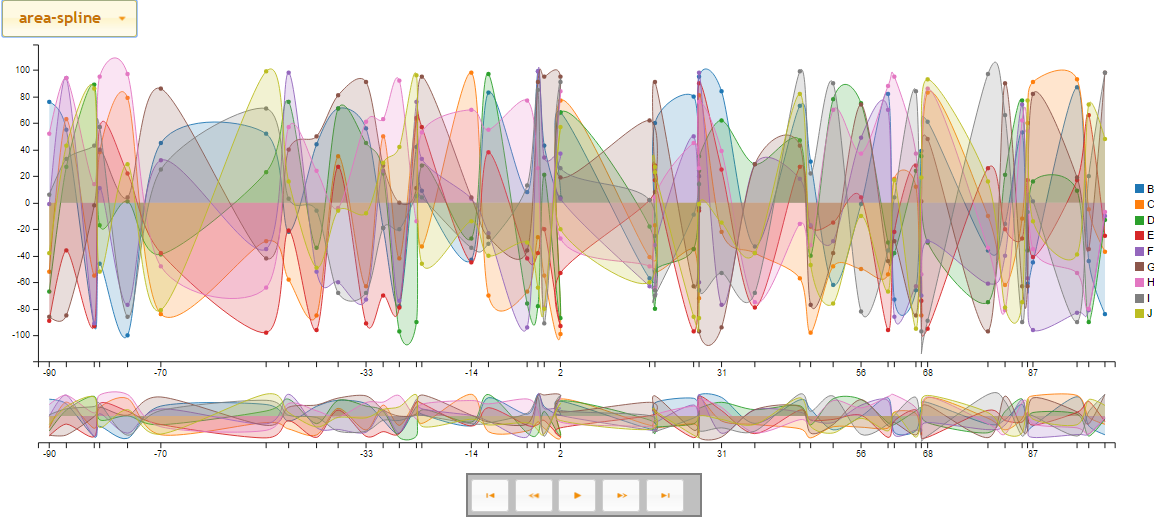
 ## Time Visualizations
This visualization depicts a small series over time.
## Time Visualizations
This visualization depicts a small series over time.
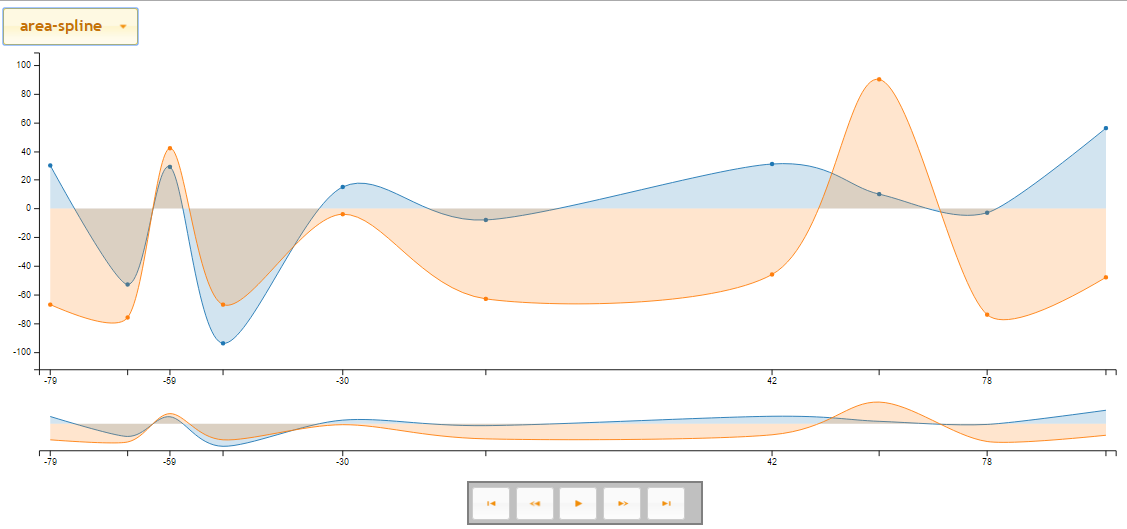 This visualization depicts a more complex series over time.
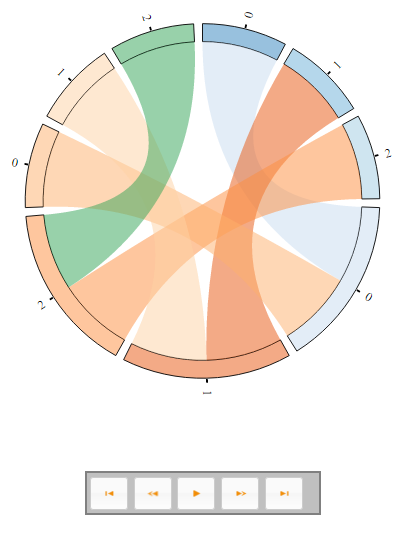
 ## Chord Visualizations
This visualization depicts relationships via a Chord diagram over time.
## Chord Visualizations
This visualization depicts relationships via a Chord diagram over time.
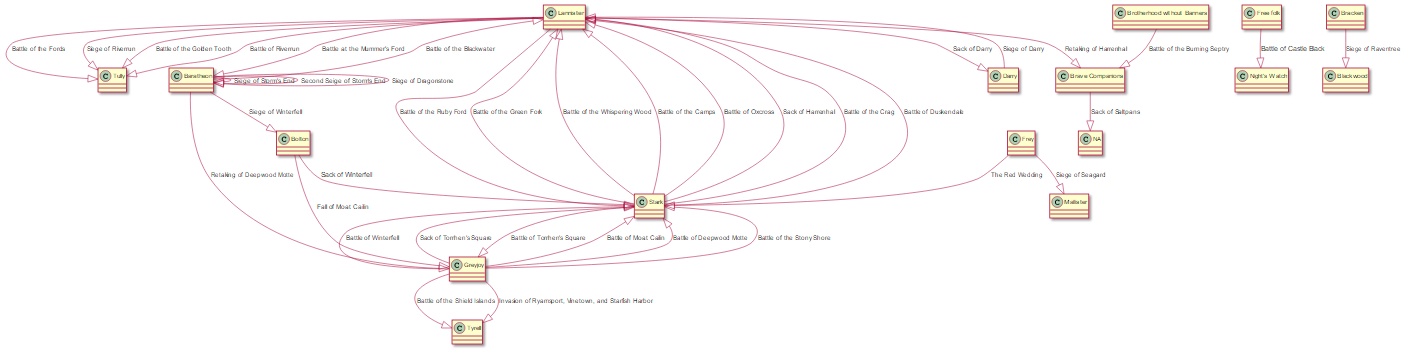
 ## UML Visualizations
A Class Diagram of the various battles within the Game of Thrones.
## UML Visualizations
A Class Diagram of the various battles within the Game of Thrones.
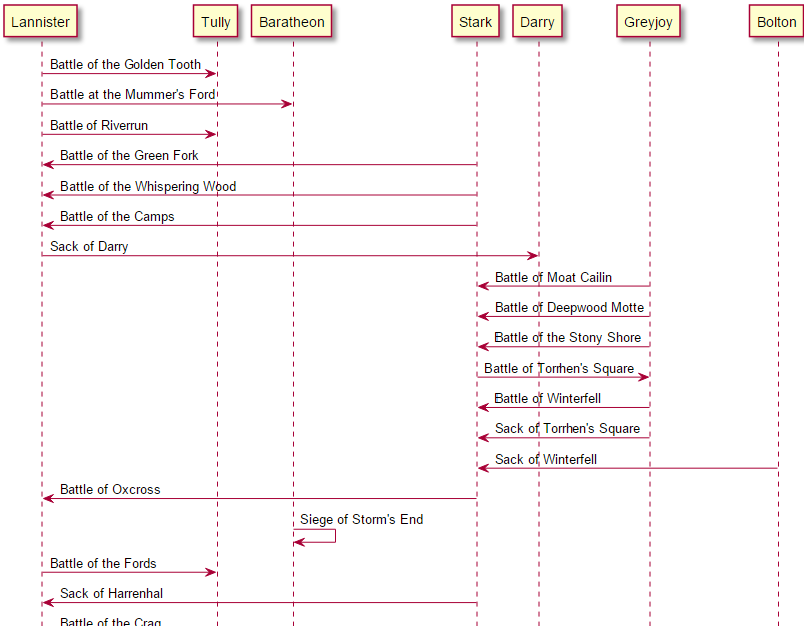
 A Sequence Diagram of the various battles within the Game of Thrones.
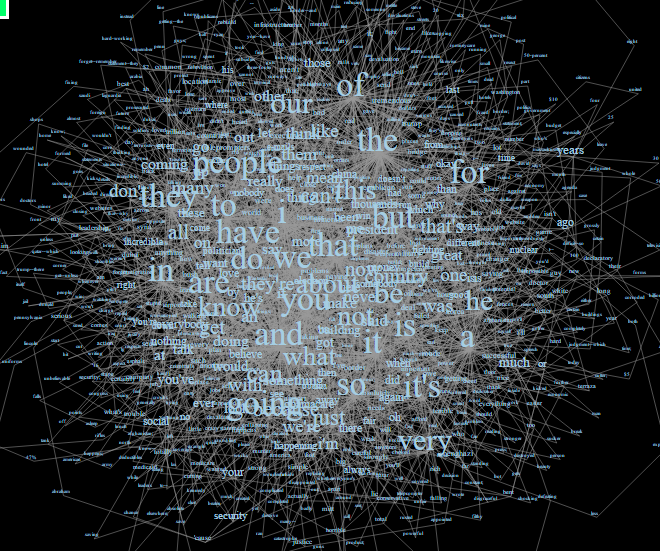
 ## Network Visualizations
A large network comprised of every word spoken by Donald trump connected by the next word within the Iowa speech. This network visualization is founded on the high performance VivaGraph.
## Network Visualizations
A large network comprised of every word spoken by Donald trump connected by the next word within the Iowa speech. This network visualization is founded on the high performance VivaGraph.
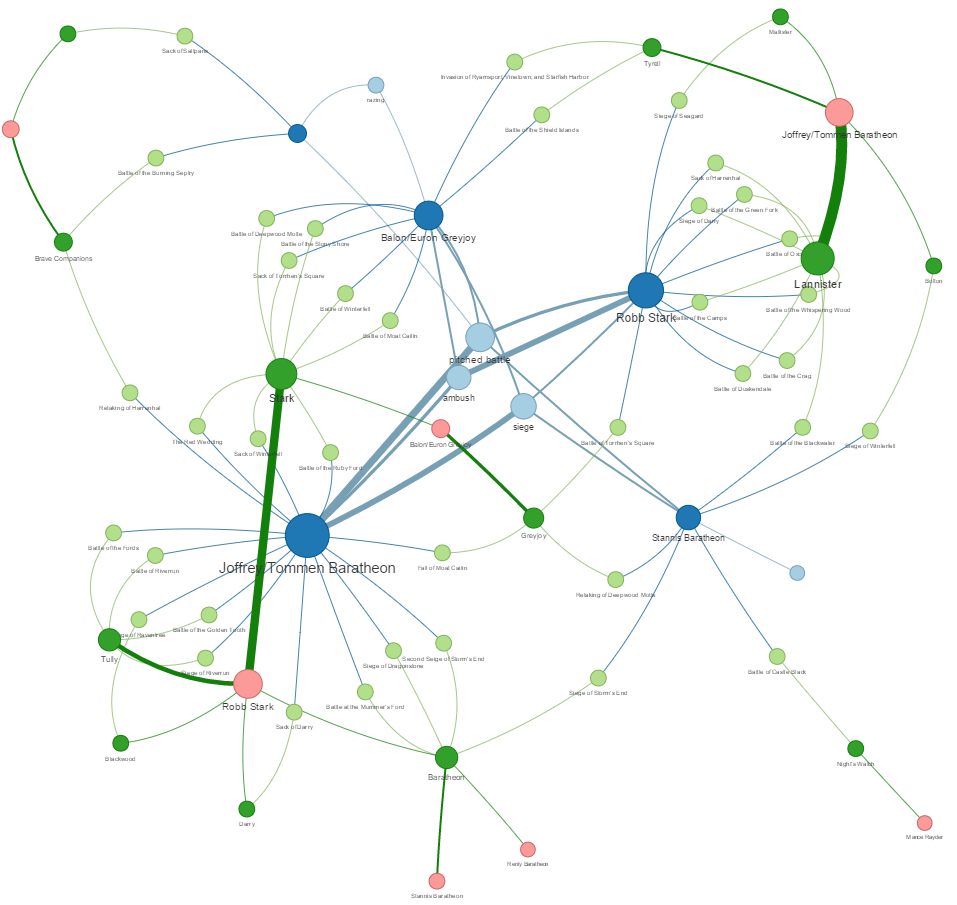
 A vis.js visualization of the battles between the various houses within the Game of Thrones.
 ## Timelines
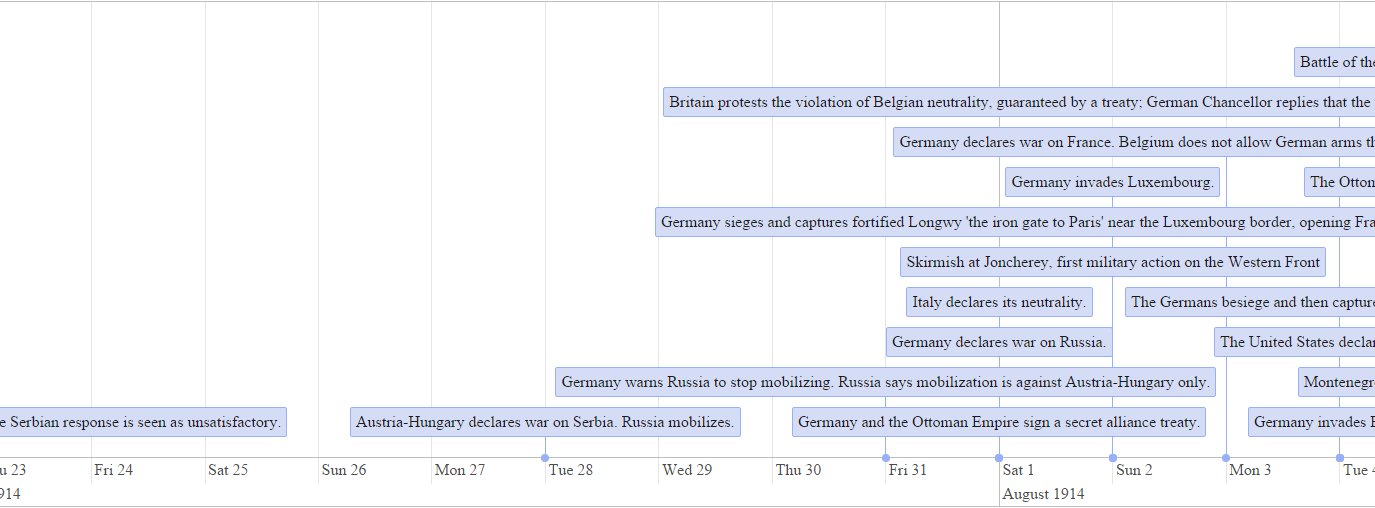
A vis.js timeline visualization of the sequence of events that lead up to, and occurred during World War I.
## Timelines
A vis.js timeline visualization of the sequence of events that lead up to, and occurred during World War I.
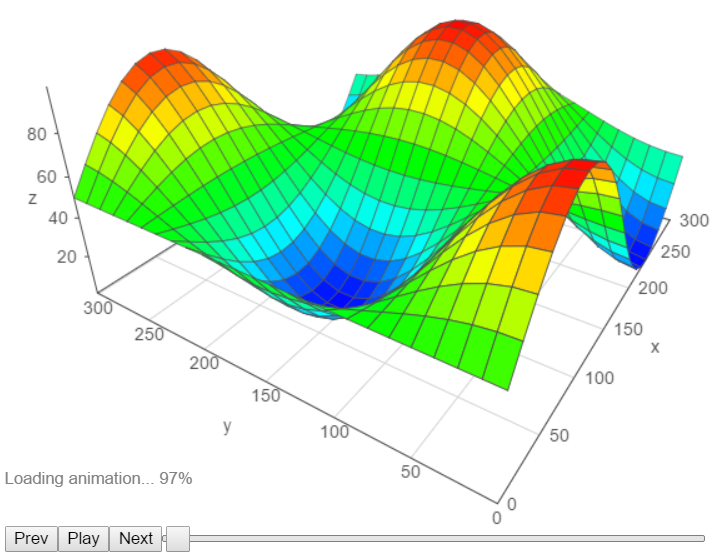
 ## 3D Graphs
A 3D graph of some data generated via Dex using a vis.js visual.
## 3D Graphs
A 3D graph of some data generated via Dex using a vis.js visual.