

代码拉取完成,页面将自动刷新

Python ❤️ ECharts = pyecharts
![]()
![]()
![]()


![]()
![]()
Apache ECharts is easy-to-use, highly interactive and highly performant javascript visualization library under Apache license. Since its first public release in 2013, it now dominates over 74% of Chinese web front-end market. Yet Python is an expressive language and is loved by data science community. Combining the strength of both technologies, pyecharts is born.
v0.5.x is not compatible with V1, which is a completely new version, see ISSUE#892, ISSUE#1033. pyecharts/issues/1033).
Support for Python 2.7, 3.4+
At the discretion of the development team, version 0.5.x will no longer be maintained. Version 0.5.x code is located in the 05x branch and documentation is located at 05x-docs.pyecharts.org.
Python 3.6+ only
The new version series will start with v1.0.0, documented at pyecharts.org; examples at gallery.pyecharts.org
Python 3.6+ only
The new version is based on Echarts 5.4.1+ for rendering, and the documentation and examples are in the same location as V1.
pip install
$ pip install pyecharts
Install from source
$ git clone https://github.com/pyecharts/pyecharts.git
$ cd pyecharts
$ pip install -r requirements.txt
$ python setup.py install
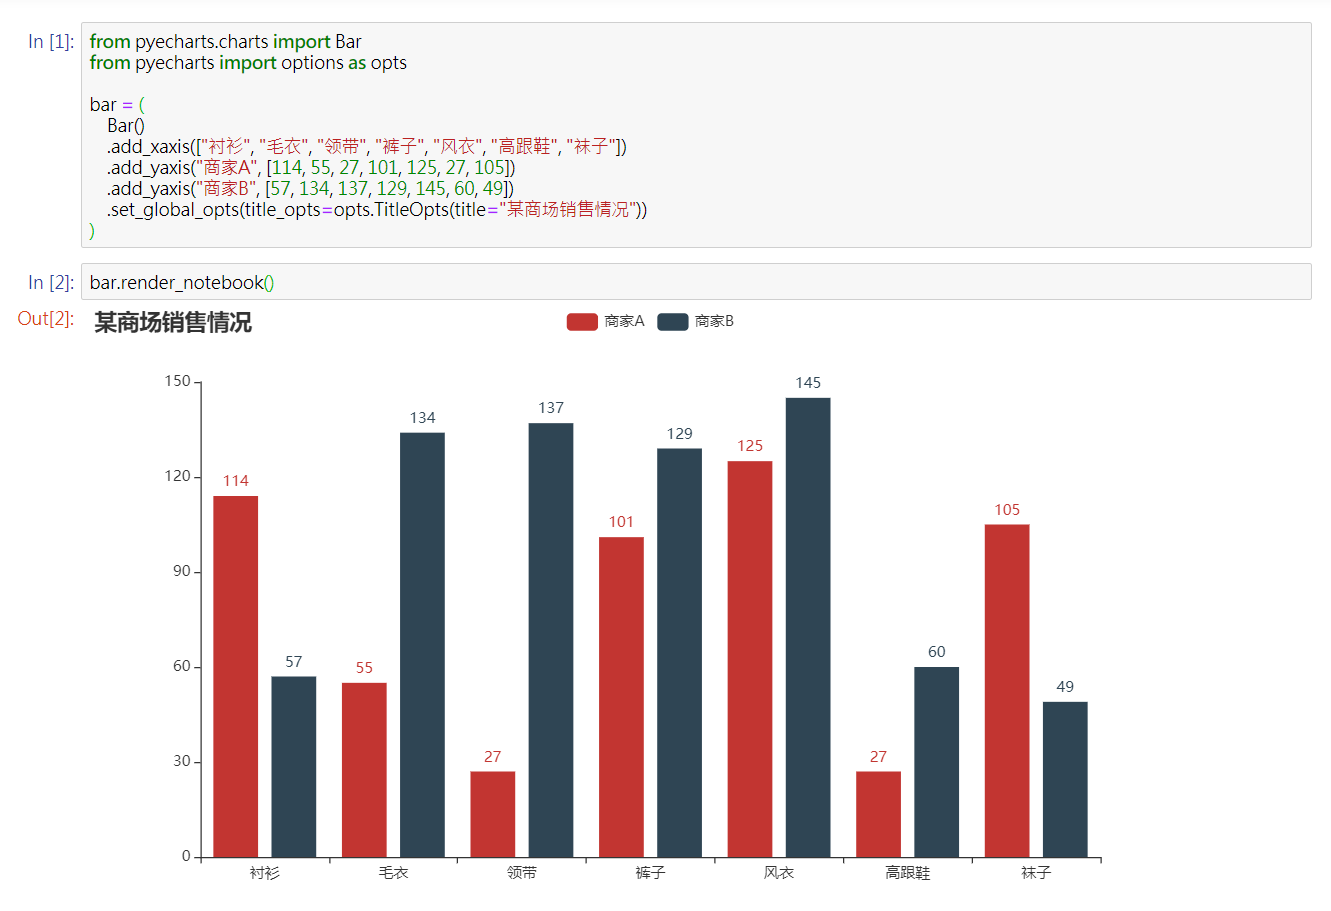
from pyecharts.charts import Bar
from pyecharts import options as opts

bar = (
    Bar()
    .add_xaxis(["衬衫", "毛衣", "领带", "裤子", "风衣", "高跟鞋", "袜子"])
    .add_yaxis("商家A", [114, 55, 27, 101, 125, 27, 105])
    .add_yaxis("商家B", [57, 134, 137, 129, 145, 60, 49])
    .set_global_opts(title_opts=opts.TitleOpts(title="某商场销售情况"))
)
bar.render()

from pyecharts.render import make_snapshot

# needs to configure selenium
make_snapshot(bar.render(), "bar.png")


For more documentation, please visit
$ pip install -r test/requirements.txt
$ make
Travis CI and AppVeyor is place for continuous integration.
flake8, Codecov and pylint are used
pyecharts are co-maintained by:
For more contributors, please visit pyecharts/graphs/contributors
To develop and maintain pyecharts, it took me a lot of overnights. If you think pyecharts has helped you, please consider buying me a coffee:


Please also buy the other maintainer a coffee if you think their work helped you too donation details
MIT ©chenjiandongx
此处可能存在不合适展示的内容,页面不予展示。您可通过相关编辑功能自查并修改。
如您确认内容无涉及 不当用语 / 纯广告导流 / 暴力 / 低俗色情 / 侵权 / 盗版 / 虚假 / 无价值内容或违法国家有关法律法规的内容,可点击提交进行申诉,我们将尽快为您处理。


