# lets-plot
**Repository Path**: mirrors_JetBrains/lets-plot
## Basic Information
- **Project Name**: lets-plot
- **Description**: Multiplatform plotting library based on the Grammar of Graphics
- **Primary Language**: Unknown
- **License**: MIT
- **Default Branch**: master
- **Homepage**: None
- **GVP Project**: No
## Statistics
- **Stars**: 0
- **Forks**: 1
- **Created**: 2020-08-09
- **Last Updated**: 2026-02-28
## Categories & Tags
**Categories**: Uncategorized
**Tags**: None
## README
# Lets-Plot
[](https://confluence.jetbrains.com/display/ALL/JetBrains+on+GitHub)
[](https://raw.githubusercontent.com/JetBrains/lets-plot-kotlin/master/LICENSE)
[](https://github.com/JetBrains/lets-plot/releases/latest)
**Lets-Plot** is a multiplatform plotting library built on the principles of the Grammar of Graphics.
The library design is heavily influenced by Leland Wilkinson's work [The Grammar of Graphics](https://www.goodreads.com/book/show/2549408.The_Grammar_of_Graphics) describing the deep features that underlie all statistical graphics.
> This grammar [...] is made up of a set of independent components that can be composed in many different ways. This makes [it] very powerful because you are not limited to a set of pre-specified graphics, but you can create new graphics that are precisely tailored for your problem.
> - Hadley Wickham, "[ggplot2: Elegant Graphics for Data Analysis](https://ggplot2-book.org/index.html)"
## Grammar of Graphics for Python [](https://pypi.org/project/lets-plot)
A bridge between R (ggplot2) and Python data visualization. \
To learn more, see the documentation site at **[lets-plot.org/python](https://lets-plot.org/python)**.
## Grammar of Graphics for Kotlin [](https://github.com/JetBrains/lets-plot-kotlin/releases/latest)
### Notebooks
Create plots in [Kotlin Notebook](https://plugins.jetbrains.com/plugin/16340-kotlin-notebook),
[Datalore](https://datalore.jetbrains.com/report/static/HZqq77cegYd.E7get_WnChZ/aTA9lQnPkRwdCzT6uy95GZ), [Jupyter with Kotlin Kernel](https://github.com/Kotlin/kotlin-jupyter#readme) \
or any other notebook that supports `Kotlin Kernel`. \
To learn more, see the **[Lets-Plot Kotlin API](https://github.com/JetBrains/lets-plot-kotlin)** project at GitHub.
### Compose Multiplatform
Embed Lets-Plot charts in [Compose Multiplatform](https://github.com/JetBrains/compose-multiplatform) applications. \
To learn more, see the **[Lets-Plot Compose Frontend](https://github.com/JetBrains/lets-plot-compose)** project at GitHub.
### JVM and Kotlin/JS
Embed Lets-Plot charts in JVM (Swing, JavaFX) and Kotlin/JS applications.
To learn more, see the **[Lets-Plot Kotlin API](https://github.com/JetBrains/lets-plot-kotlin)** project at GitHub.
### Documentation
Kotlin API documentation site: [lets-plot.org/kotlin](https://lets-plot.org/kotlin).
## "Lets-Plot in SciView" plugin
[](http://plugins.jetbrains.com/plugin/14379-lets-plot-in-sciview)
[](http://plugins.jetbrains.com/plugin/14379-lets-plot-in-sciview)
*Scientific mode* in PyCharm and in IntelliJ IDEA provides support for interactive scientific computing and data visualization.
[*Lets-Plot in SciView*](https://plugins.jetbrains.com/plugin/14379-lets-plot-in-sciview) plugin adds
support for interactive plotting to IntelliJ-based IDEs with the *Scientific mode* enabled.
>
> **Note:** The *Scientific mode* is NOT available in communinty editions of JetBrains IDEs.
>
Also read:
- [Scientific mode in PyCharm](https://www.jetbrains.com/help/pycharm/matplotlib-support.html)
- [Scientific mode in IntelliJ IDEA](https://www.jetbrains.com/help/idea/matplotlib-support.html)
## What is new in 4.8.0
- #### `geom_pointdensity()` Geometry
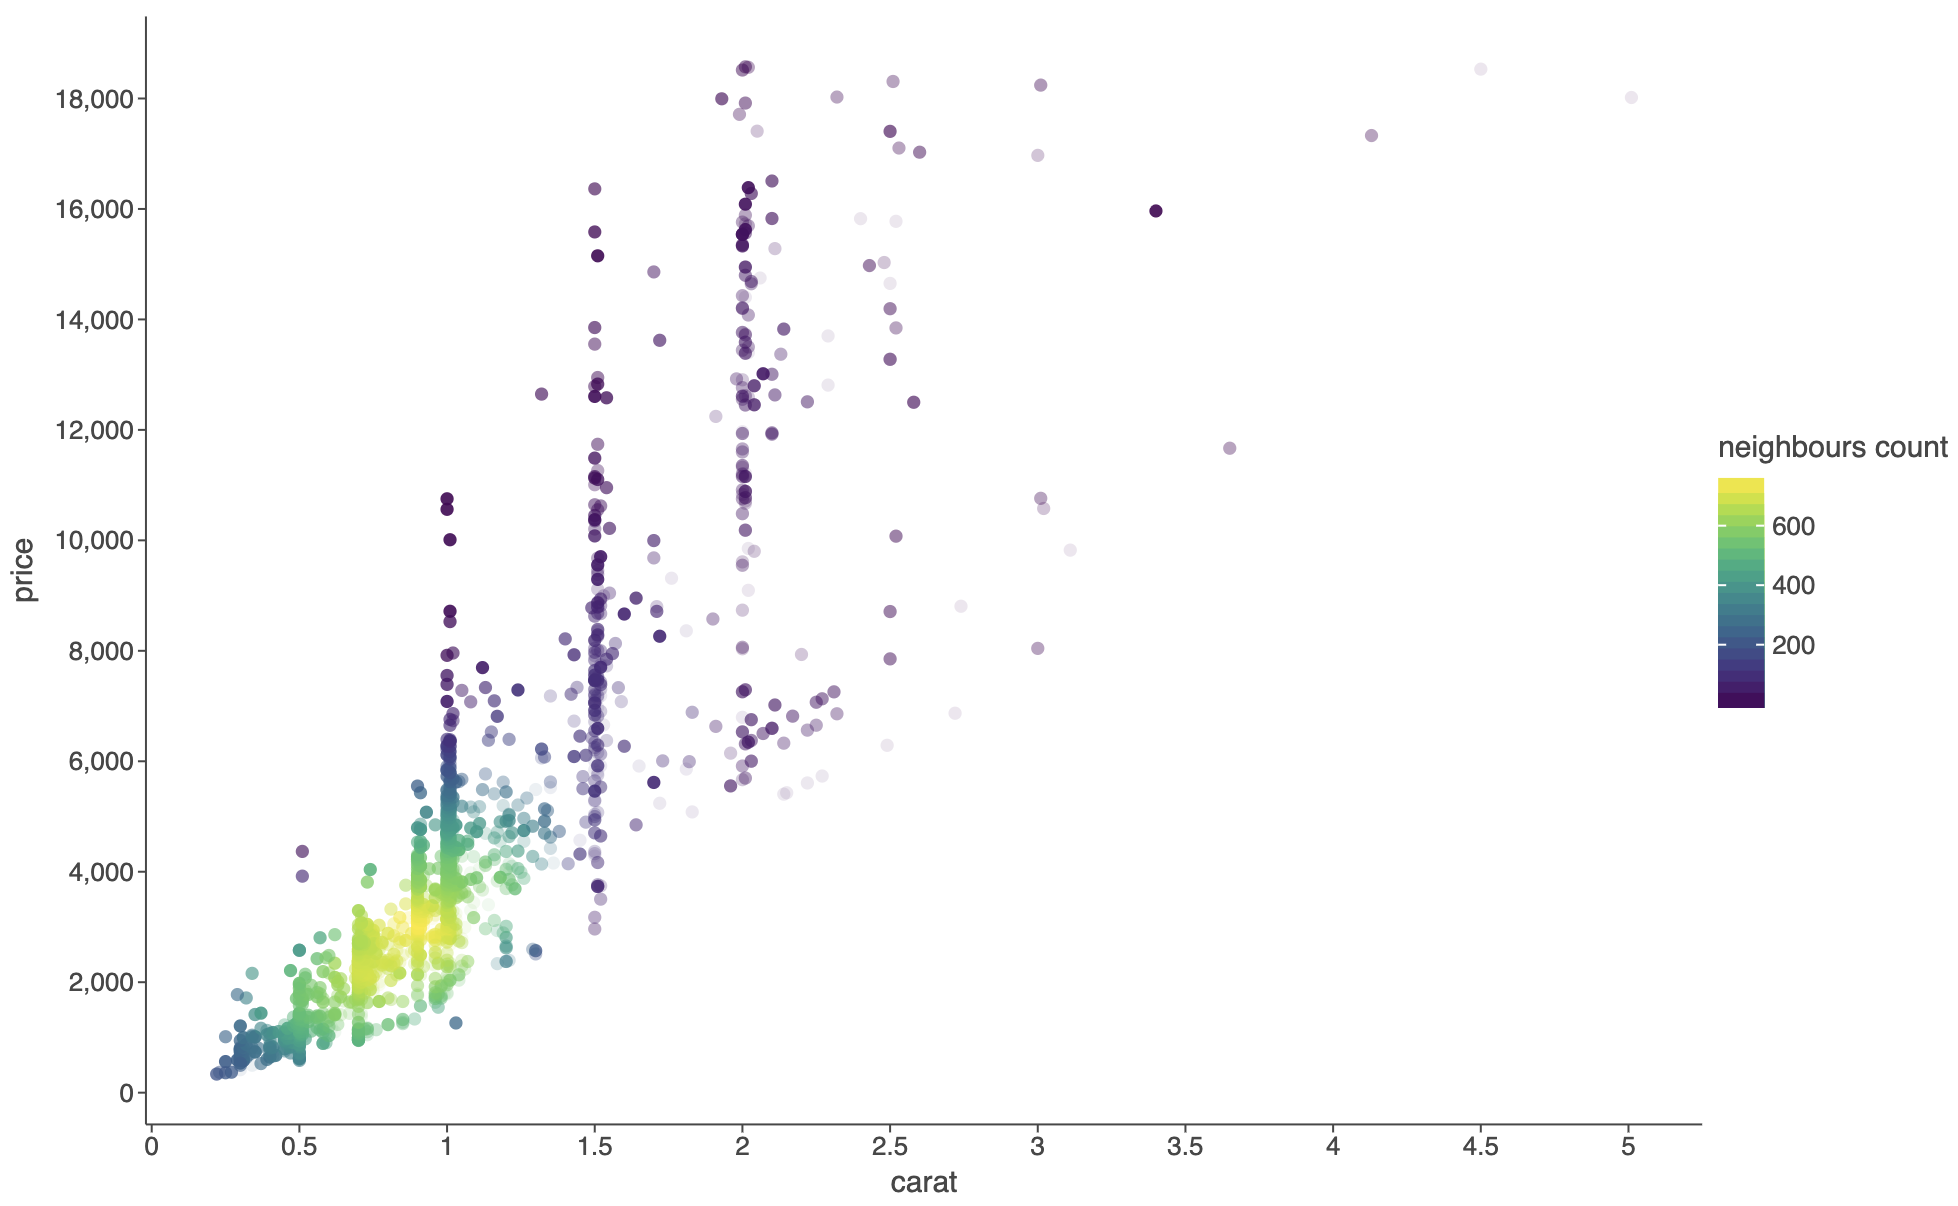 See [example notebook](https://raw.githack.com/JetBrains/lets-plot/master/docs/f-25e/geom_pointdensity.html).
- #### Explicit `group` aesthetic now overrides default grouping behavior instead of combining with it
> [!IMPORTANT]
> **BREAKING CHANGE:**
>
> Previously, setting `group='variable'` would group by both the explicit variable AND any discrete
> aesthetics (color, shape, etc.). \
> Now it groups ONLY by the explicit variable, matching `ggplot2` behavior. \
> Use `group=[var1, var2, ...]` to group by multiple variables explicitly, \
> and `group=[]` to disable any grouping.
See [example notebook](https://raw.githack.com/JetBrains/lets-plot/master/docs/f-25e/geom_pointdensity.html).
- #### Explicit `group` aesthetic now overrides default grouping behavior instead of combining with it
> [!IMPORTANT]
> **BREAKING CHANGE:**
>
> Previously, setting `group='variable'` would group by both the explicit variable AND any discrete
> aesthetics (color, shape, etc.). \
> Now it groups ONLY by the explicit variable, matching `ggplot2` behavior. \
> Use `group=[var1, var2, ...]` to group by multiple variables explicitly, \
> and `group=[]` to disable any grouping.
 See [example notebook](https://raw.githack.com/JetBrains/lets-plot/master/docs/f-25e/group_override_defaults.html).
- #### `gggrid()`: support for shared legends (parameter `guides`)
See [example notebook](https://raw.githack.com/JetBrains/lets-plot/master/docs/f-25e/group_override_defaults.html).
- #### `gggrid()`: support for shared legends (parameter `guides`)
 See [example notebook](https://raw.githack.com/JetBrains/lets-plot/master/docs/f-25e/gggrid_legend_collect.html).
- #### Better handling of missing values in `geom_line(), geom_path(), geom_ribbon()`, and `geom_area()`
See [example notebook](https://raw.githack.com/JetBrains/lets-plot/master/docs/f-25e/gggrid_legend_collect.html).
- #### Better handling of missing values in `geom_line(), geom_path(), geom_ribbon()`, and `geom_area()`
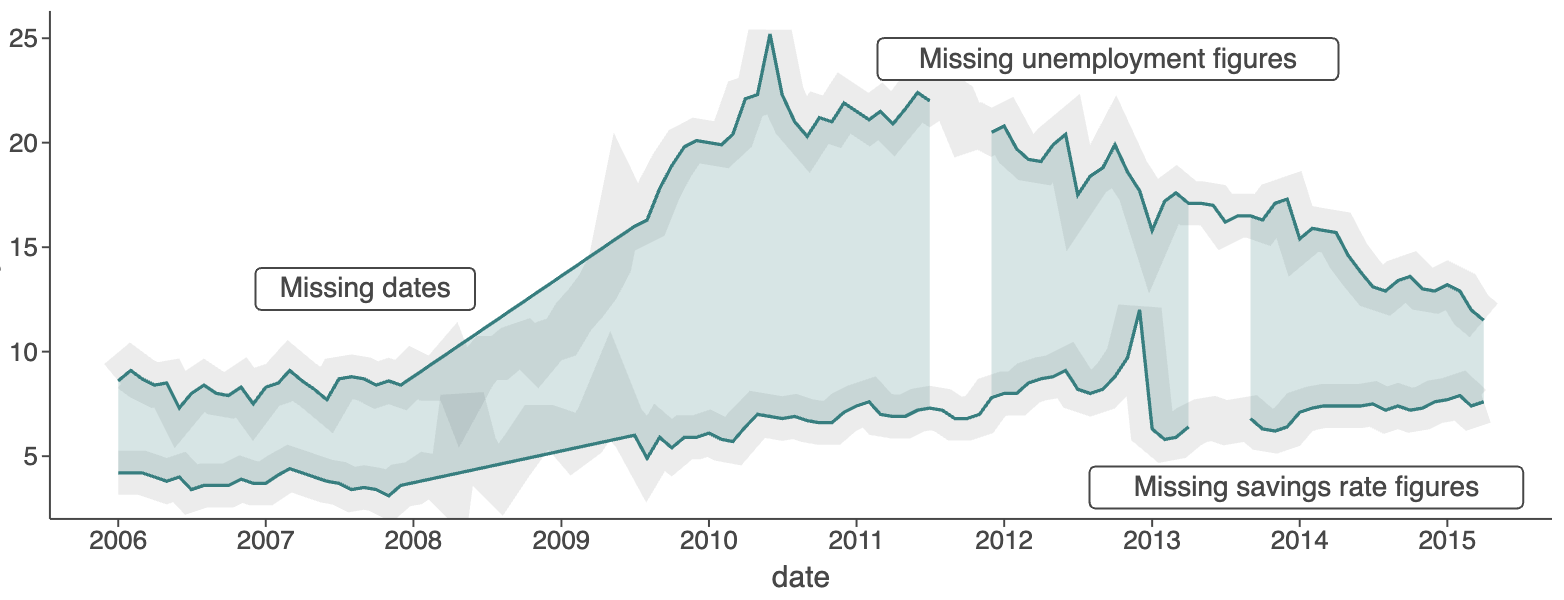 See [example notebook](https://raw.githack.com/JetBrains/lets-plot/master/docs/f-25e/missing_values_line_path_area_ribbon.html).
- #### `geom_histogram()`: custom bin bounds (parameter `breaks`)
See [example notebook](https://raw.githack.com/JetBrains/lets-plot/master/docs/f-25e/geom_histogram_param_breaks.html).
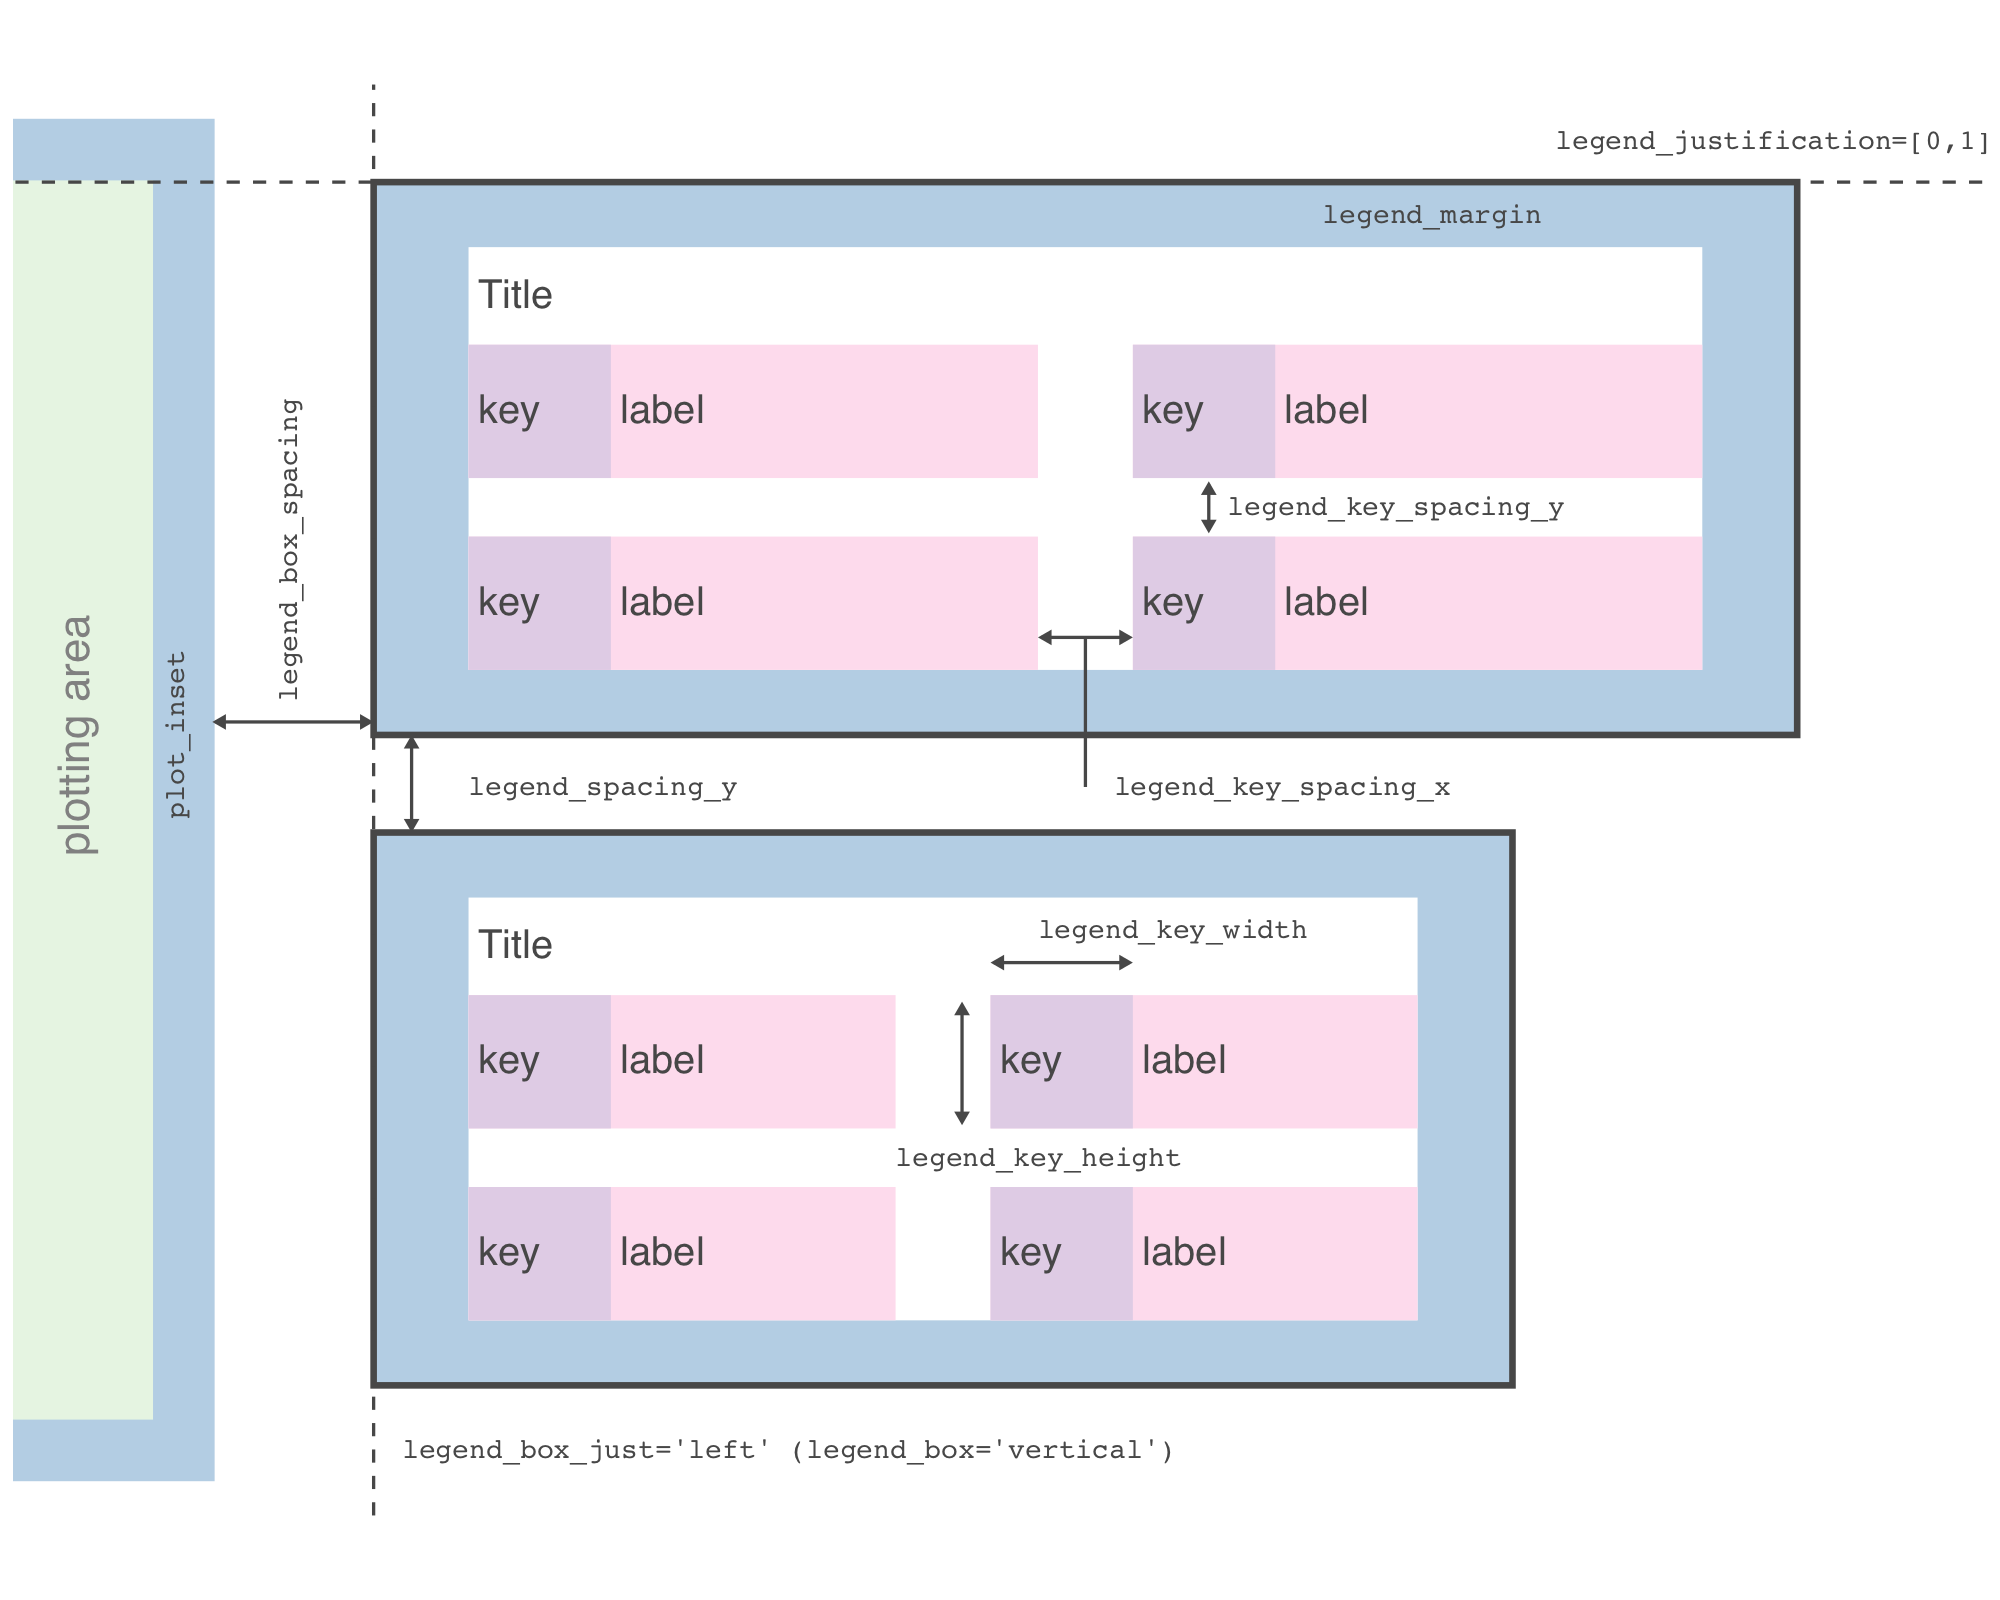
- #### Legend automatically wraps to prevent overlap — up to 15 rows for vertical legends and 5 columns for horizontal ones
See [example notebook](https://raw.githack.com/JetBrains/lets-plot/master/docs/f-25e/legend_wrap.html).
- #### `flavor_standard()` resets the theme's default color scheme
Use to override other flavors or make defaults explicit.
See [example notebook](https://raw.githack.com/JetBrains/lets-plot/master/docs/f-25e/flavor_standard.html).
- #### `'left'`, `'right'`, `'top'`, and `'bottom'` legend justification
See [example notebook](https://raw.githack.com/JetBrains/lets-plot/master/docs/f-25e/legend_justification.html).
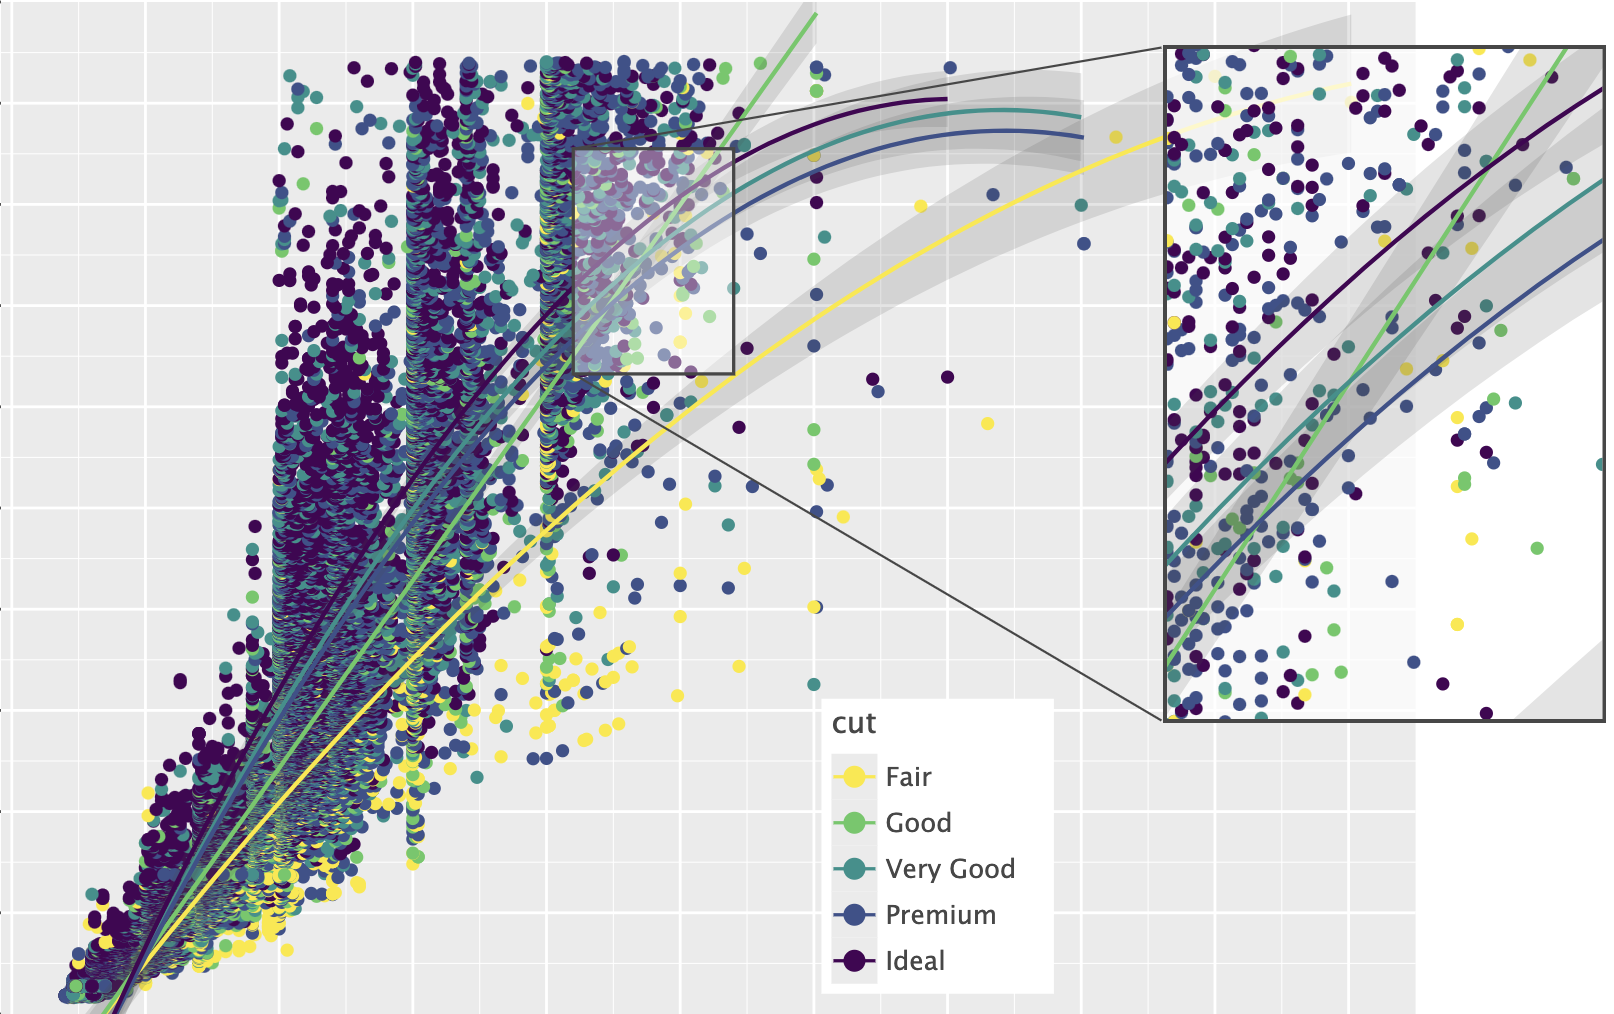
- #### `ggtb()`: Added `size_zoomin` and `size_basis` parameters to control point size scaling behavior when zooming (works with `geom_point` and related layers).
See: [example notebook](https://raw.githack.com/JetBrains/lets-plot/master/docs/f-25e/ggtb_size_zoomin.html).
- #### And More
See [CHANGELOG.md](https://github.com/JetBrains/lets-plot/blob/master/CHANGELOG.md) for a full list of changes.
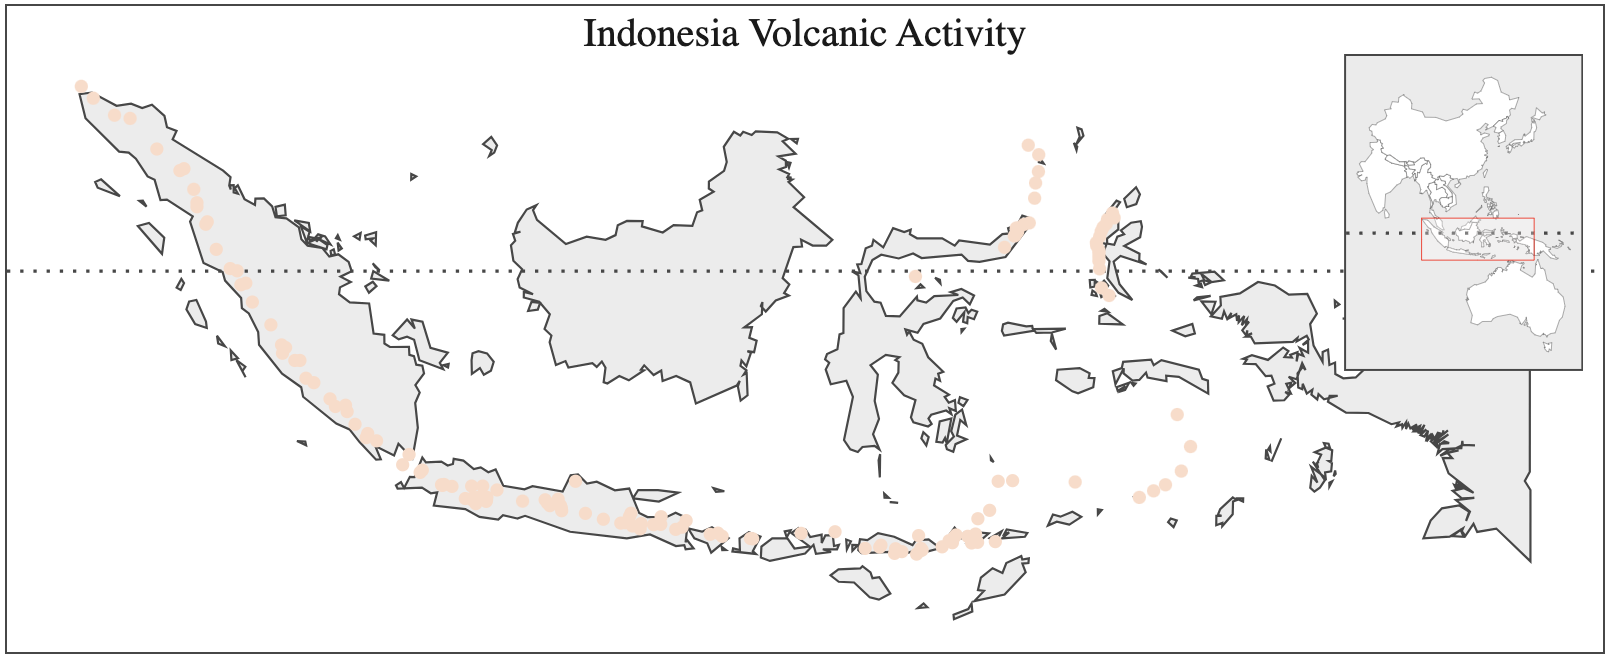
## Recent Updates in the [Gallery](https://lets-plot.org/python/pages/gallery.html)
See [example notebook](https://raw.githack.com/JetBrains/lets-plot/master/docs/f-25e/missing_values_line_path_area_ribbon.html).
- #### `geom_histogram()`: custom bin bounds (parameter `breaks`)
See [example notebook](https://raw.githack.com/JetBrains/lets-plot/master/docs/f-25e/geom_histogram_param_breaks.html).
- #### Legend automatically wraps to prevent overlap — up to 15 rows for vertical legends and 5 columns for horizontal ones
See [example notebook](https://raw.githack.com/JetBrains/lets-plot/master/docs/f-25e/legend_wrap.html).
- #### `flavor_standard()` resets the theme's default color scheme
Use to override other flavors or make defaults explicit.
See [example notebook](https://raw.githack.com/JetBrains/lets-plot/master/docs/f-25e/flavor_standard.html).
- #### `'left'`, `'right'`, `'top'`, and `'bottom'` legend justification
See [example notebook](https://raw.githack.com/JetBrains/lets-plot/master/docs/f-25e/legend_justification.html).
- #### `ggtb()`: Added `size_zoomin` and `size_basis` parameters to control point size scaling behavior when zooming (works with `geom_point` and related layers).
See: [example notebook](https://raw.githack.com/JetBrains/lets-plot/master/docs/f-25e/ggtb_size_zoomin.html).
- #### And More
See [CHANGELOG.md](https://github.com/JetBrains/lets-plot/blob/master/CHANGELOG.md) for a full list of changes.
## Recent Updates in the [Gallery](https://lets-plot.org/python/pages/gallery.html)


 ## Change Log
[CHANGELOG.md](https://github.com/JetBrains/lets-plot/blob/master/CHANGELOG.md)
## Code of Conduct
This project and the corresponding community are governed by the
[JetBrains Open Source and Community Code of Conduct](https://confluence.jetbrains.com/display/ALL/JetBrains+Open+Source+and+Community+Code+of+Conduct).
Please make sure you read it.
## License
Code and documentation released under the [MIT license](https://github.com/JetBrains/lets-plot/blob/master/LICENSE).
Copyright © 2019-2025, JetBrains s.r.o.
## Change Log
[CHANGELOG.md](https://github.com/JetBrains/lets-plot/blob/master/CHANGELOG.md)
## Code of Conduct
This project and the corresponding community are governed by the
[JetBrains Open Source and Community Code of Conduct](https://confluence.jetbrains.com/display/ALL/JetBrains+Open+Source+and+Community+Code+of+Conduct).
Please make sure you read it.
## License
Code and documentation released under the [MIT license](https://github.com/JetBrains/lets-plot/blob/master/LICENSE).
Copyright © 2019-2025, JetBrains s.r.o.