Lets-Plot Kotlin API is largely based on the API
provided by
ggplot2 package well-known to data scientists who use R.
To learn more about the Grammar of Graphics,
we recommend an excellent book called
“ggplot2: Elegant Graphics for Data Analysis”.
This will be a good prerequisite for further exploration of the Lets-Plot library.
 See: [example notebook](https://raw.githack.com/JetBrains/lets-plot-kotlin/refs/heads/master/docs/examples/jupyter-notebooks/f-4.13.0/smooth_summary.html).
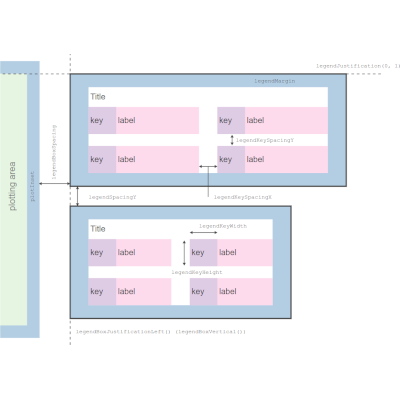
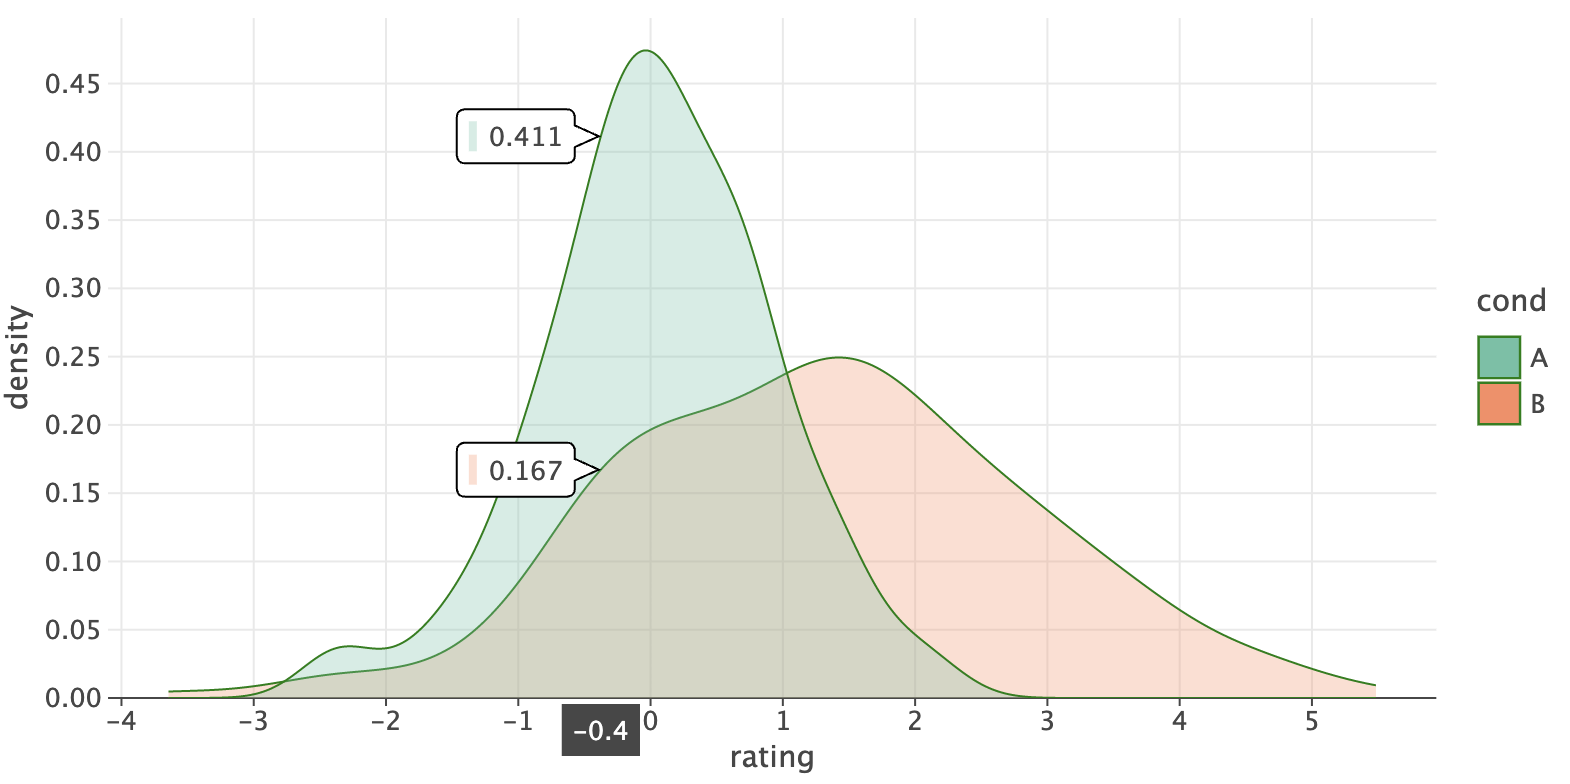
- #### Plot Tags
Plot tags are short labels attached to a plot.
See: [example notebook](https://raw.githack.com/JetBrains/lets-plot-kotlin/refs/heads/master/docs/examples/jupyter-notebooks/f-4.13.0/smooth_summary.html).
- #### Plot Tags
Plot tags are short labels attached to a plot.
 See: [example notebook](https://raw.githack.com/JetBrains/lets-plot-kotlin/refs/heads/master/docs/examples/jupyter-notebooks/f-4.13.0/plot_tags.html) and updated [Plot Layout Diagrams](https://lets-plot.org/kotlin/presentation-options.html#plot-layout-diagrams).
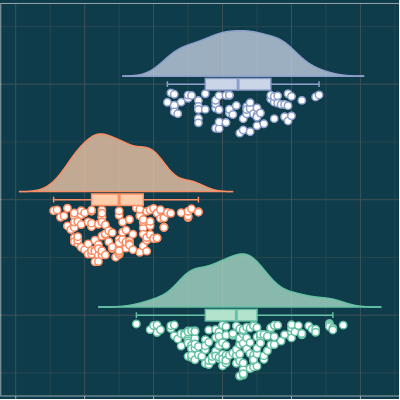
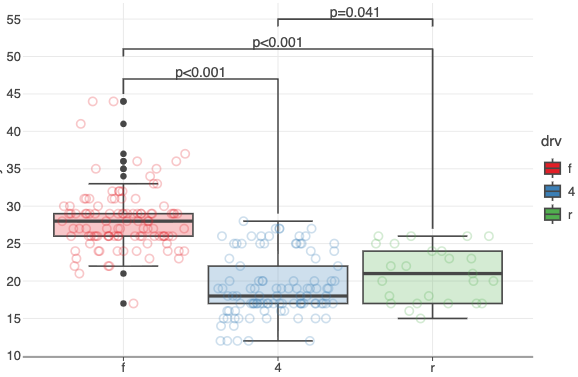
- #### New `geomBracket()` and `geomBracketDodge()` Geometries
New geometries designed primarily for significance bars (*p-values*) annotations in categorical plots.
See: [example notebook](https://raw.githack.com/JetBrains/lets-plot-kotlin/refs/heads/master/docs/examples/jupyter-notebooks/f-4.13.0/plot_tags.html) and updated [Plot Layout Diagrams](https://lets-plot.org/kotlin/presentation-options.html#plot-layout-diagrams).
- #### New `geomBracket()` and `geomBracketDodge()` Geometries
New geometries designed primarily for significance bars (*p-values*) annotations in categorical plots.
 See: [example notebook](https://raw.githack.com/JetBrains/lets-plot-kotlin/refs/heads/master/docs/examples/jupyter-notebooks/f-4.13.0/geom_bracket.html).
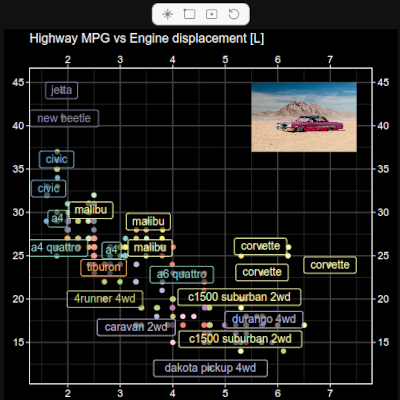
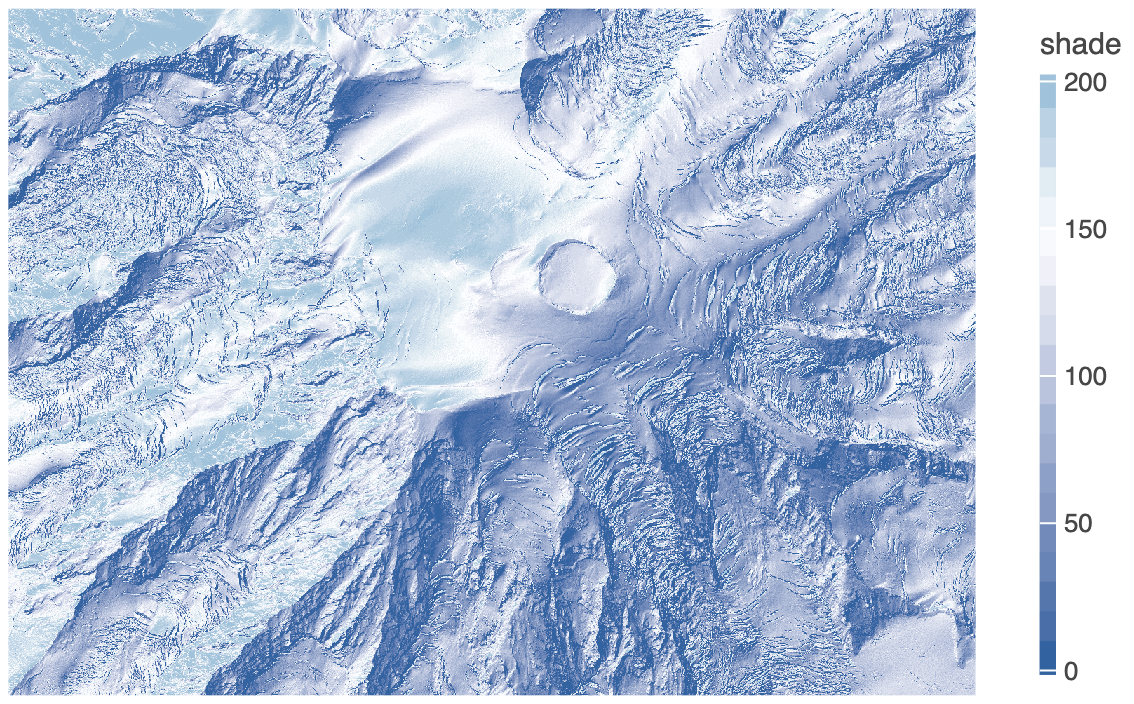
- #### Custom Color Palettes in `geomImshow()`
The `cmap` parameter now allows you to specify a list of hex color codes for visualizing grayscale images. \
Also, the new `cguide` parameter lets you customize the colorbar for grayscale images.
See: [example notebook](https://raw.githack.com/JetBrains/lets-plot-kotlin/refs/heads/master/docs/examples/jupyter-notebooks/f-4.13.0/geom_bracket.html).
- #### Custom Color Palettes in `geomImshow()`
The `cmap` parameter now allows you to specify a list of hex color codes for visualizing grayscale images. \
Also, the new `cguide` parameter lets you customize the colorbar for grayscale images.
 See: [example notebook](https://raw.githack.com/JetBrains/lets-plot-kotlin/refs/heads/master/docs/examples/jupyter-notebooks/f-4.13.0/image_custom_cmap.html).
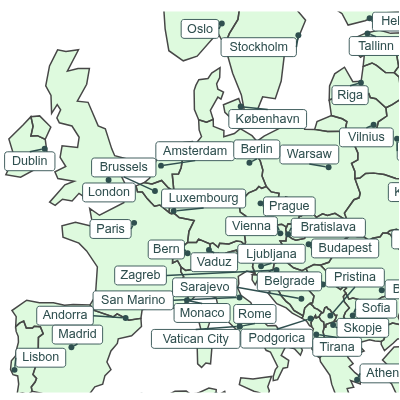
- #### New `palette()` Method in Color Scales
Generates a list of hex color codes that can be used with `scaleColorManual()` to maintain consistent colors across multiple plots.
See: [example notebook](https://raw.githack.com/JetBrains/lets-plot-kotlin/refs/heads/master/docs/examples/jupyter-notebooks/f-4.13.0/scale_color_palette.html).
- #### New `overflow` parameter in `scaleColorBrewer()`, `scaleFillBrewer()`
Controls how colors are generated when more colors are needed than the palette provides. \
Options: `'interpolate'` (`'i'`), `'cycle'` (`'c'`), `'generate'` (`'g'`).
See: [example notebook](https://raw.githack.com/JetBrains/lets-plot-kotlin/refs/heads/master/docs/examples/jupyter-notebooks/f-4.13.0/scale_brewer_overflow.html).
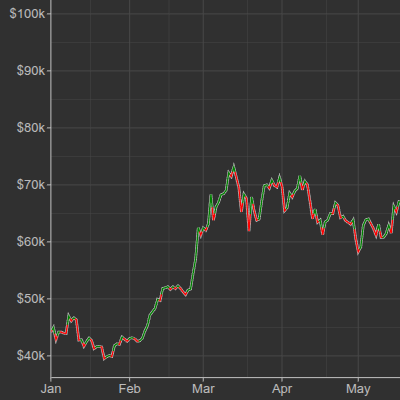
- #### New `breakWidth` Parameter in Positional Scales
Specifies a fixed distance between axis breaks.
See examples:
- [datetime scale](https://raw.githack.com/JetBrains/lets-plot-kotlin/refs/heads/master/docs/examples/jupyter-notebooks/f-4.13.0/scale_break_width_datetime.html)
- [time (duration) scale](https://raw.githack.com/JetBrains/lets-plot-kotlin/refs/heads/master/docs/examples/jupyter-notebooks/f-4.13.0/scale_break_width_duration.html)
- [log10 scale](https://raw.githack.com/JetBrains/lets-plot-kotlin/refs/heads/master/docs/examples/jupyter-notebooks/f-4.13.0/scale_break_width_log10.html)
- #### Axis Minor Ticks Customization
The `axisMinorTicks` and `axisMinorTicksLength` parameters in `theme()`.
See: [example notebook](https://raw.githack.com/JetBrains/lets-plot-kotlin/refs/heads/master/docs/examples/jupyter-notebooks/f-4.13.0/axis_minor_ticks.html).
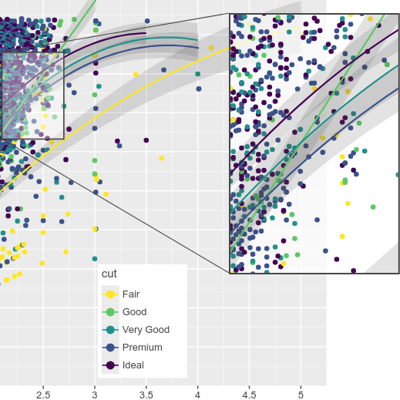
- #### Pan/Zoom in `gggrid()` with Shared Axes
Pan/Zoom now propagates across subplots with shared axes (`sharex`/`sharey`).
See: [example notebook](https://raw.githack.com/JetBrains/lets-plot-kotlin/refs/heads/master/docs/examples/jupyter-notebooks/f-4.13.0/gggrid_scale_share_zoom.html).
- #### And More
See [CHANGELOG.md](https://github.com/JetBrains/lets-plot-kotlin/blob/master/CHANGELOG.md) for a full list of changes.
See: [example notebook](https://raw.githack.com/JetBrains/lets-plot-kotlin/refs/heads/master/docs/examples/jupyter-notebooks/f-4.13.0/image_custom_cmap.html).
- #### New `palette()` Method in Color Scales
Generates a list of hex color codes that can be used with `scaleColorManual()` to maintain consistent colors across multiple plots.
See: [example notebook](https://raw.githack.com/JetBrains/lets-plot-kotlin/refs/heads/master/docs/examples/jupyter-notebooks/f-4.13.0/scale_color_palette.html).
- #### New `overflow` parameter in `scaleColorBrewer()`, `scaleFillBrewer()`
Controls how colors are generated when more colors are needed than the palette provides. \
Options: `'interpolate'` (`'i'`), `'cycle'` (`'c'`), `'generate'` (`'g'`).
See: [example notebook](https://raw.githack.com/JetBrains/lets-plot-kotlin/refs/heads/master/docs/examples/jupyter-notebooks/f-4.13.0/scale_brewer_overflow.html).
- #### New `breakWidth` Parameter in Positional Scales
Specifies a fixed distance between axis breaks.
See examples:
- [datetime scale](https://raw.githack.com/JetBrains/lets-plot-kotlin/refs/heads/master/docs/examples/jupyter-notebooks/f-4.13.0/scale_break_width_datetime.html)
- [time (duration) scale](https://raw.githack.com/JetBrains/lets-plot-kotlin/refs/heads/master/docs/examples/jupyter-notebooks/f-4.13.0/scale_break_width_duration.html)
- [log10 scale](https://raw.githack.com/JetBrains/lets-plot-kotlin/refs/heads/master/docs/examples/jupyter-notebooks/f-4.13.0/scale_break_width_log10.html)
- #### Axis Minor Ticks Customization
The `axisMinorTicks` and `axisMinorTicksLength` parameters in `theme()`.
See: [example notebook](https://raw.githack.com/JetBrains/lets-plot-kotlin/refs/heads/master/docs/examples/jupyter-notebooks/f-4.13.0/axis_minor_ticks.html).
- #### Pan/Zoom in `gggrid()` with Shared Axes
Pan/Zoom now propagates across subplots with shared axes (`sharex`/`sharey`).
See: [example notebook](https://raw.githack.com/JetBrains/lets-plot-kotlin/refs/heads/master/docs/examples/jupyter-notebooks/f-4.13.0/gggrid_scale_share_zoom.html).
- #### And More
See [CHANGELOG.md](https://github.com/JetBrains/lets-plot-kotlin/blob/master/CHANGELOG.md) for a full list of changes.