# universal-profiling-documentation
**Repository Path**: mirrors_elastic/universal-profiling-documentation
## Basic Information
- **Project Name**: universal-profiling-documentation
- **Description**: No description available
- **Primary Language**: Unknown
- **License**: Not specified
- **Default Branch**: main
- **Homepage**: None
- **GVP Project**: No
## Statistics
- **Stars**: 0
- **Forks**: 0
- **Created**: 2022-10-24
- **Last Updated**: 2026-05-02
## Categories & Tags
**Categories**: Uncategorized
**Tags**: None
## README

Welcome to the Universal Profiling **private beta** documentation. Here, you'll learn how to configure and use Universal Profiling.
If you haven't already, you can sign up for the private beta [here](https://docs.google.com/forms/d/e/1FAIpQLSd-SWVgvhO7Z_jAfaV9_bFGa0dUZPuX0JORzPGS8SDP7G-dVQ/viewform).
If you're already running Universal Profiling in Kibana, see [Universal Profiling features](./features.md) for more information on viewing and inspecting your data.
We would appreciate feedback on your experience with this product and any other profiling pain points you may have. See the **[Send Feedback](#send-feedback)** section
at the end of this documentation for more information.
## Prerequisites
Before setting up Universal Profiling, make sure you meet the following requirements:
- An Elastic stack deployment on [Elastic Cloud](http://cloud.elastic.co) at version 8.5.0 or higher (you can either provision a new one or upgrade an existing one). Universal Profiling is currently only available on Elastic Cloud.
- The workloads (to be profiled) must be running on Linux machines; with kernel version >= 4.15
- The Integrations Server must be enabled on your Elastic Cloud deployment.
- Credentials (either an API key or username and password) for the `superuser` Elasticsearch role (typically, the `elastic` user).
- An x86_64 Linux machine with a terminal to run commands.
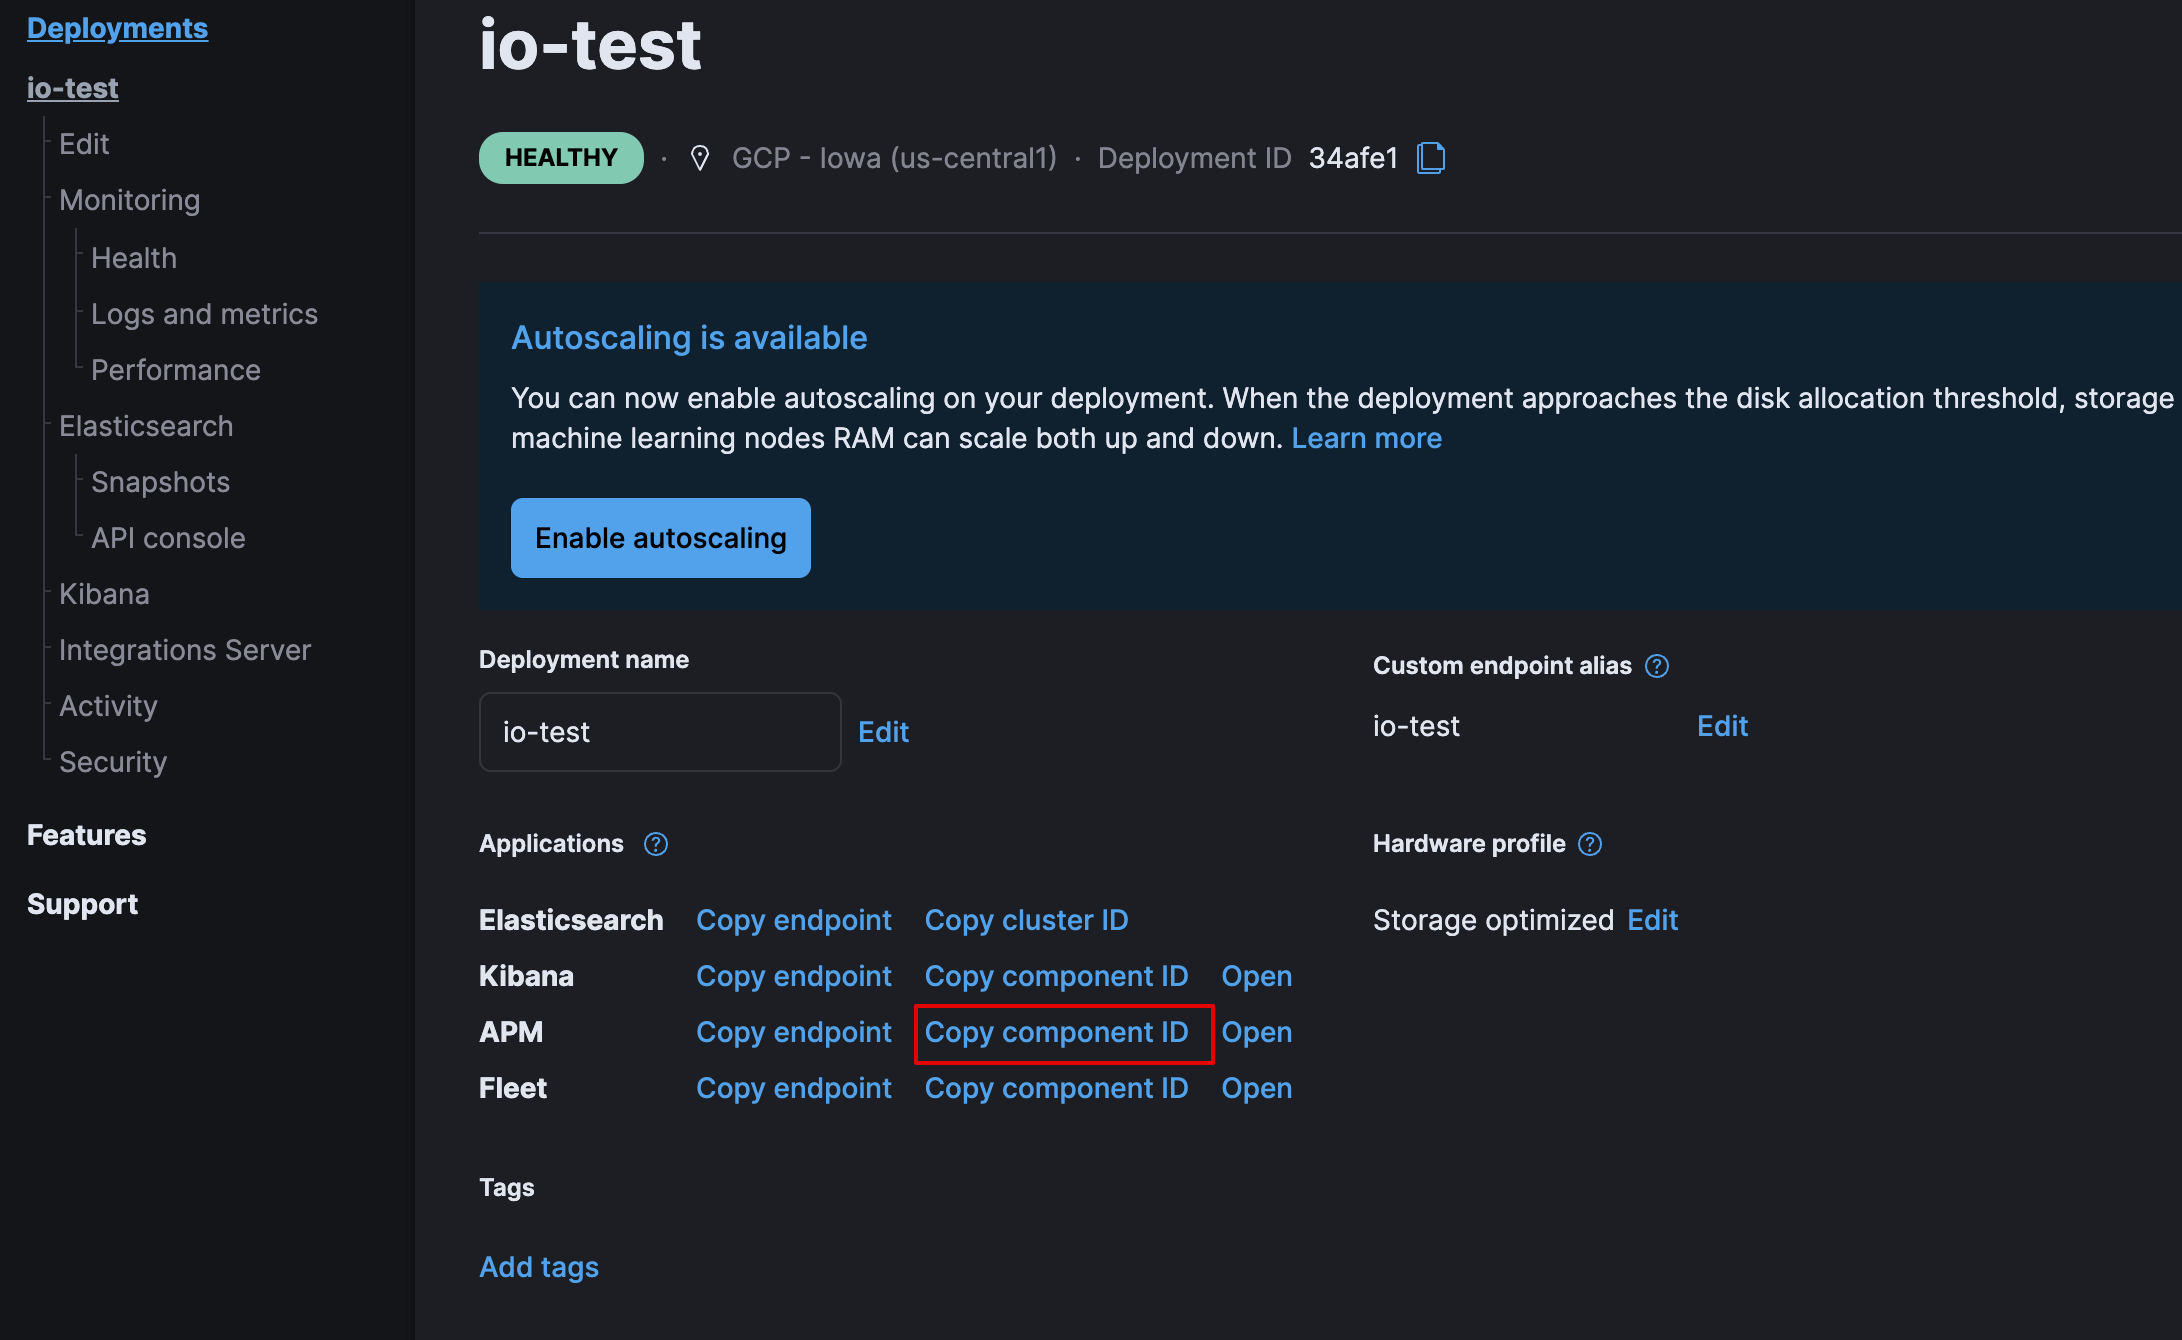
- The deployment's Cloud ID from the deployment overview page.

- The deployment's APM Component ID from the deployment overview page.
### Interpreters
Universal Profiling is a system-wide profiling solution with additional support for PHP, Python, Java (or any JVM language), Go, Rust, C/C++, Node.js/V8, Ruby, and Perl.
The minimum supported versions of interpreters are:
- JVM/JDK: >= 7
- Python: >= 3.6
- V8: >= 8.1.0
- Perl: >= 5.28
- PHP: >= 7.3
- Ruby: >= 2.5
### Preparation
Prepare a configuration file `config.txt` with the following command, using the values from your deployment instead of the placeholders:
```
cat < config.txt
export ES_USER=
export ES_PASSWORD=
export ES_CLOUD_ID=
export ES_APM_CLUSTER_ID=
EOF
```
This file will be used to run commands later on.
- Use the `superuser` Elasticsearch credentials for `` and ``.
- Get the deployment's Cloud ID from the deployment overview page and use it as ``.
- Get your deployment's APM Cluster ID from the deployment overview page and use it as ``.
- Please use real values instead of the placeholders, e.g. replace `` with `elastic`.
The environment variables can be overridden by command line arguments, for details run `./elastic-profiling config --help`.
### Deployment configuration example
The following deployment configuration example was tested to support profiling data from a fleet of up to 500 hosts, each with 8 or 16 CPU cores, for a total of roughly 6000 cores:
| Component | Size per zone (memory) | Zones |
|---------------------|------------------------|-------|
| Elasticsearch | 64 GB | 2 |
| Kibana | 8 GB | 1 |
| Integrations Server | 8 GB | 1 |
Even if you're profiling a smaller fleet, we recommend configuring at least two zones for Elasticsearch and 4 GB of memory each for the Integrations Server and Kibana.
## Set up Universal Profiling on a Cloud deployment
To set up Universal Profiling on your Elastic Cloud deployment, you need to:
- Enable the Universal Profiling app in Kibana
- Configure data ingestion
### Enable Universal Profiling in Kibana
To enable Universal Profiling in Kibana:
1. Log in to [Elastic Cloud](https://cloud.elastic.co) and locate your deployment.
2. Click the **Manage deployment** icon next to your deployment.
3. Click **Edit** in the navigation menu.
4. Scroll down to the Kibana section, and click **Edit user settings**.

5. Add the following line to the user settings:
```yaml
xpack.profiling.enabled: true
```

6. Click **Back** at the bottom of the **User settings** pane.
7. Scroll to the bottom of the **Edit** page, and click **Save**.
After you've enabled Universal Profiling in Kibana, it's located under **Observability** in the navigation menu.
### Configure data ingestion
To configure data ingestion:
1. On your x86_64 Linux machine, open a terminal to execute the following steps.
1. Download and extract the `elastic-profiling` CLI by replacing the `` placeholder in the following example with the URL you received in your private beta onboarding call:
```bash
wget -O- | tar xz
chmod +x elastic-profiling
```
If you haven't signed up for the private beta, sign up [here](https://docs.google.com/forms/d/e/1FAIpQLSd-SWVgvhO7Z_jAfaV9_bFGa0dUZPuX0JORzPGS8SDP7G-dVQ/viewform).
1. Set up Universal Profiling in your deployment.
```
source config.txt
./elastic-profiling setup cloud --reset
```
1. Confirm that this is the first time setting up Universal Profiling in the terminal prompt.
If Universal Profiling is already installed, confirm with your cluster administrator that it's ok to erase all existing profiling data.
## Install the host-agent
The host-agent profiles your fleet, and you need to install and configure it on every machine that you want to profile. It needs elevated privileges in order to run (currently: `root` / `CAP_SYS_ADMIN`).
To complete the basic setup of a host-agent on your Linux machine:
1. Use `elastic-profiling` to print the host-agent installation and configuration instructions for various package formats.
The default package format is binary, but there are also instructions for DEB, RPM, Docker, and Kubernetes. The DEB and
RPM package formats contain systemd service definitions that ensure the host-agent stays running as a service.
To list all available package formats, run:
```bash
./elastic-profiling help config
```
1. Print the `binary` configuration to test it on your current Linux machine by running:
```bash
source config.txt
./elastic-profiling config --binary
```
1. Run the host-agent with the provided steps, testing that your Universal Profiling deployment is working as expected.
The host-agent prints out logs that notify you if the connection to Elastic Cloud is not working.
In this case, see [troubleshooting and support](#troubleshooting-and-support).
1. After a few minutes, open Kibana and confirm that you can see stacktraces data coming from your host by
navigating to the **Threads** tab in **Observability > Universal Profiling > Stacktraces**. You should see a graph and a
list of processes.
1. If everything is working correctly, you can now print more configurations to deploy the host-agents on your fleet.
**Host-agent configuration notes**
- The printed configuration uses a `stable` version. This is good for testing environments. For production environmnets, we recommend using immutable versioned artifacts.
- The host-agent versioning scheme is **not aligned with the Elastic stack version scheme**.
- The OS packages downloaded from `releases.prodfiler.com` have a version in their file name.
- You can find a list of container image versions in the
[Elastic container library repository](https://container-library.elastic.co/r/observability/profiling-agent).
- For Kubernetes deployments, the Helm chart version is already used to configure the same container image, unless
overwritten with the `version` parameter in values.
## Split or filter data from multiple workloads
`elastic-profiling config` prints a default configuration that allows ingesting data into a Cloud deployment.
There is only one config knob that you can change: `project-id` (default value is `1`).
The `-project-id` flag, or the `project-id` key in the host-agent configuration file, is a parameter to split
profiling data into logical groups that you control.
You can assign any non-zero, unsigned integer to a host-agent deployment you control. In Kibana,
the KQL field `service.name` is mapped to `project-id` and you can use it to slice or filter data.
You may want to set a per-environment project ID (for example, dev=3, staging=2, production=1), a per-datacenter project ID (for example,
DC1=1, DC2=2), or even a per-k8s-cluster project ID (for example, us-west2-production=100, eu-west1-production=101).
You can also use the `-tags` flag to associate an arbitrary string with a specific host-agent instance.
Each tag must match `^[a-zA-Z0-9-:._]+$` regex and use `;` as a separator. Invalid tags are dropped
and warnings issued on startup.
In Kibana, the KQL field `tags` can be used for filtering. For example:
```
sudo pf-host-agent/pf-host-agent -project-id=1 -tags='cloud_region:us-central1;env:staging'
```
## Use a proxy
The `HTTPS_PROXY` environment variable can be used to configure a proxy that the host-agent will use.
The connection to the backend (Elastic Cloud) will be tunneled through the proxy (no MITM-TLS) using
the CONNECT method. Basic authentication is supported. This can be useful in environments with security
policies or network restrictions that block direct connections to outside hosts. See the following example:
```
export HTTPS_PROXY=http://username:password@proxy:port
```
## Add symbols for native frames
To see function names and line numbers in traces of applications written in programming languages that
compile to native code (C, C++, Rust, Go, ...), the user must first push symbols to the cluster. You can do this with the `elastic-profiling push-symbols` command.
### Go applications
The meta-information in Go binaries allows them to be symbolized even if they were stripped.
No additional parameters need to be passed during the build. To push symbols for a Go binary,
invoke the `elastic-profiling` tool:
```
source config.txt
./elastic-profiling push-symbols executable -e ./my-go-app
```
### C, C++, and Rust applications
C/C++ applications must be built with debug symbols (`-g`) for symbolization to work. Rust applications
must be built with [`debug = 1`][cargo-debug] (or higher). The debug info doesn't have to be deployed to
production, but needs to be present temporarily to push them to the Elastic cluster.
[cargo-debug]: https://doc.rust-lang.org/cargo/reference/profiles.html#debug
If you don't mind deploying your applications with debug symbols, run:
```
source config.txt
./elastic-profiling push-symbols executable -e ./my-c-app
```
If you don't want debug symbols in production, copy the executable and strip the copy.
You can then use the `-d` argument to instruct the tool to read the symbols from the original
unstripped binary while still calculating the file hash from the final stripped binary. After
the symbols have been pushed, you can remove the unstripped binary:
```
cp ./my-app ./my-stripped-app
strip ./my-stripped-app
source config.txt
./elastic-profiling push-symbols executable -e ./my-stripped-app -d ./my-app
rm ./my-app
```
> **Warning**
>
> Pushing debug information and then stripping the binary later **does not work**:
> the executable passed using the `-e` argument is used to calculate the file hash that
> associates stack traces with their symbols and stripping the binary later changes that hash.
### Linux distribution packages
For Debian, Ubuntu, Fedora, and Arch Linux, the `elastic-profiling` tool supports pushing symbols
for an entire package at once. The required debug symbols are automatically retrieved from
the distribution's [debuginfod] server.
[debuginfod]: https://wiki.debian.org/Debuginfod
For this to work, make sure that the debuginfod client is installed on your machine.
| Distro | Install command |
|--------|-----------------------------------------------|
| Debian | `sudo apt install debuginfod` |
| Ubuntu | `sudo apt install debuginfod` |
| Fedora | `sudo dnf install elfutils-debuginfod-client` |
| Arch | `sudo pacman -S debuginfod` |
Then, invoke `elastic-profiling` as follows:
```
source config.txt
./elastic-profiling push-symbols package -p package-name
```
For example, to push symbols for libc on Debian:
```
source config.txt
./elastic-profiling push-symbols package -p libc6
```
> **Note**
>
> debuginfod servers for many distributions can be unreliable and may result in the tool
> printing `No debug info found for executable, skipping.` for all executables. This is more common if you're on a faster
> moving release-channel of your distribution (for example, Debian Testing).
### Native symbolization limitations
In the current beta release of Elastic Universal Profiling, native symbolization is still limited
in a few important ways:
- No virtual frames for inline functions
- No symbols for leaf frames (top-most frame in a trace)
- No automatic insertion of debug symbols for OS packages
We hope to improve these limitations and remove them in later versions.
> **Note**
>
> If symbols are not displayed in Kibana after ingesting them, try restarting Kibana in your deployment (Cloud > Deployments > `` > Kibana > Force Restart).
> This is a known issue in 8.5 and will be fixed in later versions.
## Troubleshooting and support
As mentioned, you can spot errors in the host-agent logs.
The following is an example of a _healthy_ host-agent output:
```
time="..." level=info msg="Starting Prodfiler Host Agent v2.4.0 (revision develop-5cce978a, build timestamp 12345678910)"
time="..." level=info msg="Interpreter tracers: perl,php,python,hotspot,ruby,v8"
time="..." level=info msg="Automatically determining environment and machine ID ..."
time="..." level=warning msg="Environment tester (gcp) failed: failed to get GCP metadata: Get \"http://169.254.169.254/computeMetadata/v1/instance/id\": dial tcp 169.254.169.254:80: i/o timeout"
time="..." level=warning msg="Environment tester (azure) failed: failed to get azure metadata: Get \"http://169.254.169.254/metadata/instance/compute?api-version=2020-09-01&format=json\": context deadline exceeded (Client.Timeout exceeded while awaiting headers)"
time="..." level=warning msg="Environment tester (aws) failed: failed to get aws metadata: EC2MetadataRequestError: failed to get EC2 instance identity document\ncaused by: RequestError: send request failed\ncaused by: Get \"http://169.254.169.254/latest/dynamic/instance-identity/document\": context deadline exceeded (Client.Timeout exceeded while awaiting headers)"
time="..." level=info msg="Environment: hardware, machine ID: 0xdeadbeefdeadbeef"
time="..." level=info msg="Assigned ProjectID: 5"
time="..." level=info msg="Start CPU metrics"
time="..." level=info msg="Start I/O metrics"
time="..." level=info msg="Found tpbase offset: 9320 (via x86_fsbase_write_task)"
time="..." level=info msg="Environment variable KUBERNETES_SERVICE_HOST not set"
time="..." level=info msg="Supports eBPF map batch operations"
time="..." level=info msg="eBPF tracer loaded"
time="..." level=info msg="Attached tracer program"
time="..." level=info msg="Attached sched monitor"
```
A host-agent deployment is working if the output of the following command is empty:
```bash
head host-agent.log -n 15 | grep "level=error"
```
If the output of the previous command contains error-level logs, the following are possible causes:
- The host-agent is running on an unsupported version of the Linux kernel, or it can't perform its operations because
of missing kernel features.
If the host-agent is running on an outdated kernel version, the following message is logged:
```text
Host Agent requires kernel version 4.15 or newer but got 3.10.0
```
If eBPF features are not available in the kernel, the host-agent fails to start up, and one of the following messages messages are logged:
```text
Failed to probe eBPF syscall
```
or
```text
Failed to probe tracepoint
```
- The host-agent is not able to connect to Elastic Cloud.
In this case, you'll see a similar message to the following:
```text
Failed to setup gRPC connection (retrying...): context deadline exceeded
```
Verify the `collection-agent` configuration value is set and is equal to what was printed
by `elastic-profiling config`.
- The secret token is not valid, or it has been changed.
In this case, the host-agent will shut down, logging a similar error message to the following:
```text
rpc error: code = Unauthenticated desc = authentication failed
```
- The host-agent is unable to reach the collectionagent service.
In this case, you'll see a similar message to the following:
```text
Failed to report hostinfo (retrying...): rpc error: code = Unimplemented desc = unknown service collectionagent.CollectionAgent"
```
This typically means that your Cloud cluster has not been configured for Universal Profiling.
Follow the steps under the [setup](#setup) section.
- The APM server (part of the backend in Cloud that receives data from the host-agent) died
(e.g. ran out of memory):
```text
Error: failed to invoke XXX(): Unavailable rpc error: code = Unavailable desc = unexpected HTTP status code received from server: 502 (Bad Gateway); transport: received unexpected content-type "application/json; charset=UTF-8"
```
Verify that the APM server is running by navigating to **Cloud > Deployments > `` > Integrations Server**
in [Elastic Cloud](https://cloud.elastic.co/home). If the **Copy endpoint** link next to **APM** is grayed out,
you need to restart the APM server. Restart it by clicking **Force Restart** under **Integrations Server Management**.

Additionally (for non-demo workloads), verify that the integrations server has at least the recommended 4GB of RAM. You can check this on the Integrations Server page under **Instances**.
If you are unable to find a solution to the host-agent failure, you can raise a support request
indicating `Universal Profiling` and `host-agent` as the source of the problem.
### Enable verbose logging in host-agent
During the support process, you may be asked to provide debug logs from one of the host-agent installations from your
deployment.
**We recommend only enabling debug logs on a single instance of host-agent**, rather than an entire deployment because
of the amount of logs produced.
To enable debug logs, add the `-verbose` command-line flag or the `verbose true` setting in the configuration file.
### Improve load times
The amount of data loaded for the flamegraph, topN functions, and traces view can lead to latency when using a slow connection (e.g. DSL or mobile).
If you're running Kibana/ES 8.6+, setting the Kibana cluster option `server.compression.brotli.enabled: true` reduces
the amount of data to be transferred and should reduce load time.
### Troubleshoot host-agent K8s deployments
When the Helm chart installation completes, the output has instructions on how to check the host-agent pod status and
read logs. A series of potential scenarios when host-agent installation **is not healthy** follows.
#### Taints
K8s clusters often include [taints and tolerations](https://kubernetes.io/docs/concepts/scheduling-eviction/taint-and-toleration/) in their setup.
In these cases, a host-agent installation may show no pods or very few pods running, even for a large cluster.
This is because a _taint_ precludes the execution of pods on a node unless the workload has been _tolerated_.
The Helm chart `tolerations` key in the `values.yaml` sets the toleration of taints, using the official K8s scheduling API
format.
For some example use cases, we provide a `tolerations` config to be added in the Helm chart `values.yaml`
* To deploy the host-agent on all nodes with taint `workload=python:NoExecute`, add
the following to the `values.yaml`:
```
tolerations:
- key: "workload"
value: "python"
effect: "NoExecute"
```
* To deploy the host-agent on all nodes tainted with _key_ `production` and effect `NoSchedule` (no value
provided), add the following to the `values.yaml`:
```
tolerations:
- key: "production"
effect: "NoSchedule"
operator: Exists
```
* To deploy the host-agent on all nodes, tolerating all taints, add the following to the `values.yaml`:
```
tolerations:
- effect: NoSchedule
operator: Exists
- effect: NoExecute
operator: Exists
```
#### Security policy enforcement
Some K8s clusters are configured with hardened security add-ons to limit the blast radius of exploited application
vulnerabilities. Different hardening methodologies can impair host-agent operations and
may, for example, result in pods continuously restarting after displaying a `CrashLoopBackoff` status.
###### K8s PodSecurityPolicy ([deprecated](https://kubernetes.io/blog/2021/04/06/podsecuritypolicy-deprecation-past-present-and-future/))
This K8s API has been deprecated, but some still use it. A PodSecurityPolicy (PSP) may explicitly prevent the execution
of `privileged` containers across the entire cluster.
Since host-agent _needs_ privileges in most kernels/CRI, you need to build a PSP to allow the host-agent
DaemonSet to run.
##### K8s policy engines
Read more about K8s policy engines in
the [SIG-Security documentation](https://github.com/kubernetes/sig-security/blob/main/sig-security-docs/papers/policy/kubernetes-policy-management.md).
Tools like the following _may_ prevent the execution of host-agent pods as the Helm chart builds a cluster role and
binds it into the host-agent service account (we use it for container metadata):
* Open Policy Agent Gatekeeper
* Kyverno
* Fairwinds Polaris
If you have a policy engine in place, you should configure it to allow the host-agent execution and RBAC configs.
##### Network configurations
In some instances, your host-agent pods may be running fine, but they will not connect to the remote data collector gRPC interface
and stay in the startup phase, while trying to connect periodically.
The following may be causing this:
* K8s [`NetworkPolicies`](https://kubernetes.io/docs/concepts/services-networking/network-policies/) define connectivity
rules that prevent all outgoing traffic unless explicitly allow-listed
* Cloud or Datacenter provider network rules are restricting egress traffic to allowed destinations only (ACLs)
##### OS-level security
These settings _are not part of Kubernetes_ and may have been included in the setup of the nodes. They can prevent the host-agent
from working properly, as they intercept syscalls from the host-agent to the kernel and modify or block them.
If you have implemented security hardening (some providers listed below), you should know the privileges the host-agent needs.
* gVisor on GKE
* seccomp filters
* AppArmor LSM
### Submit a support request
You can submit a support request from the [support request page](https://cloud.elastic.co/support) in the Elastic Cloud console.
In the support request, specify if your issue was with the host-agent or the Kibana app.
### Send feedback
If troubleshooting and support are not fixing your issues, or you have any other feedback that you want to share about the
product, send the Profiling team an email at `profiling-feedback@elastic.co`.