# datamaps
**Repository Path**: mirrors_mathisonian/datamaps
## Basic Information
- **Project Name**: datamaps
- **Description**: Customizable SVG map visualizations for the web in a single Javascript file using D3.js
- **Primary Language**: Unknown
- **License**: MIT
- **Default Branch**: master
- **Homepage**: None
- **GVP Project**: No
## Statistics
- **Stars**: 0
- **Forks**: 0
- **Created**: 2020-09-25
- **Last Updated**: 2026-05-24
## Categories & Tags
**Categories**: Uncategorized
**Tags**: None
## README
Datamaps
======
#### Interactive maps for data visualizations. Bundled into a single Javascript file.
Datamaps is intended to provide some data visualizations based on geographical data. It's SVG-based, can scale to any screen size, and includes everything inside of 1 script file.
It heavily relies on the amazing [D3.js](https://github.com/mbostock/d3) library.
Out of the box in includes support for choropleths and bubble maps (see [demos](http://datamaps.github.io)), but it's not limited to just that. Its new plugin system allows for the addition of any type of visualization over the map.
##### For feature requests, open an issue!
##### [Contribution Guideliness](#contributing-guidelines)
#### Demos at http://datamaps.github.io
---
Downloads:
- [World map (94kb, 36.7kb gzip'd)](http://datamaps.github.io/scripts/datamaps.world.min.js)
- [USA only (35kb, 13.9kb gzip'd)](http://datamaps.github.io/scripts/datamaps.usa.min.js)
- [USA & World (131kb, 47.1kb gzip'd)](http://datamaps.github.io/scripts/datamaps.all.min.js)
- [No preset topojson (6.8kb, 2.3kb gzip'd)](http://datamaps.github.io/scripts/datamaps.none.min.js)
###Documentation
#### Getting Started
1. Include D3.js and Topojson on your page
2. Include Datamaps.js on your page
3. Add a container, set the height and width and position to relative
4. Create a `new Datamaps(options)`, passing in at least an `element` option
Example:
```html
```
This should render a new world map with a standard projection.
#### via Bower
1. `bower install datamaps`
2. Refer to file in `dist` directory, like:
```html
```
#### USA Only Map
A map of the USA with an Albers based projection will be default if you only include `datamaps.usa.min.js`, but in case you include `datamaps.all.min.js`:
```html
```
#### Changing the default fill colors
```html
```
#### Disabling popup or hover effects
```html
```
#### Using custom maps
```html
```
By specifying a `dataUrl`, Datamaps will attempt to fetch that resource as TopoJSON.
If you are using a custom map, you'll probably want to specify your own `setProjection` method as well.
`setProjection` takes 2 arguments, `element` as a DOM element, `options` as the original options you passed in. It should return an object with two properties: `path` as a `d3.geo.path`, `projection` as a `d3.geo.projection`
The example above will result in albersUsa projection.
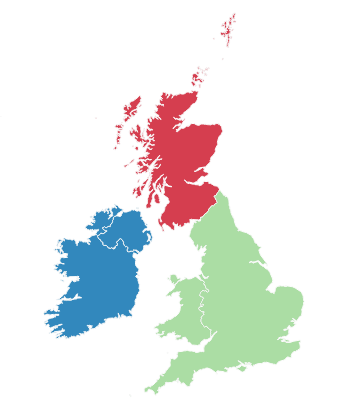
[Read about other D3.js projections](https://github.com/mbostock/d3/wiki/Geo-Projections)
[Read more about TopoJSON](https://github.com/mbostock/topojson/wiki)
#### Creating a Choropleth
Probably the most common type of map visualization, where different states or countries are color coded.
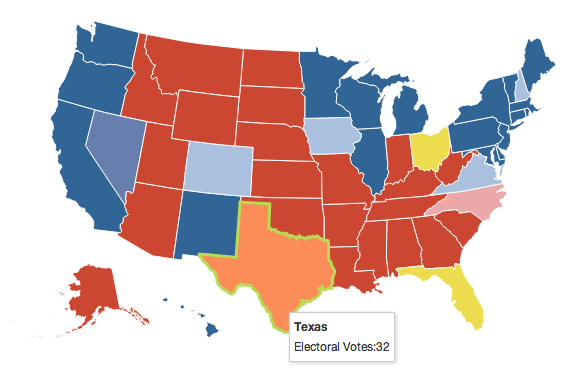
You'll need to know the 2 letter state code ('NY' for New York) or the 3 letter country code ('SCT' for Scotland) to fill in areas.
```html
```
This will draw a world map and fill in IRL (Ireland) with the corresponding `fills.LOW` and USA with `fills.MEDIUM`.
#### Updating a choropleth after initial drawing
```javascript
map.updateChoropleth({
USA: {fillKey: 'LOW'},
CAN: '#0fa0fa'
});
```
You can specify either a literal color (as a string), or an object with a fillKey property.
You can also add a map legend with the `legend` plugin (used above)
#### Custom popup on hover
Expanding on the previous example of using `data`, any property passed into `data` will be sent to the `popupTemplate` function, which can be overriden to display custom messages.
```html
```
`geographyConfig.popupTemplate` just needs to return an HTML string, so feel free to use [Handlebars](https://github.com/wycats/handlebars.js/) or [Underscore](http://underscorejs.org/#template) templates (instead of the terrible Array.join method above).
#### Bubbles
Bubbles in a core plugin that will render circles('bubbles') on different parts of the map. Each of these bubbles can be color coded in the same way a choropleth is color coded (see above 'Choropleth' example).
```js
var bombMap = new Datamap({
element: document.getElementById('map_bombs'),
scope: 'world',
geographyConfig: {
popupOnHover: false,
highlightOnHover: false
},
fills: {
'USA': '#1f77b4',
'RUS': '#9467bd',
'PRK': '#ff7f0e',
'PRC': '#2ca02c',
'IND': '#e377c2',
'GBR': '#8c564b',
'FRA': '#d62728',
'PAK': '#7f7f7f',
defaultFill: '#EDDC4E'
},
data: {
'RUS': {fillKey: 'RUS'},
'PRK': {fillKey: 'PRK'},
'PRC': {fillKey: 'PRC'},
'IND': {fillKey: 'IND'},
'GBR': {fillKey: 'GBR'},
'FRA': {fillKey: 'FRA'},
'PAK': {fillKey: 'PAK'},
'USA': {fillKey: 'USA'}
}
});
var bombs = [{
name: 'Joe 4',
radius: 25,
yeild: 400,
country: 'USSR',
fillKey: 'RUS',
significance: 'First fusion weapon test by the USSR (not "staged")',
date: '1953-08-12',
latitude: 50.07,
longitude: 78.43
},{
name: 'RDS-37',
radius: 40,
yeild: 1600,
country: 'USSR',
fillKey: 'RUS',
significance: 'First "staged" thermonuclear weapon test by the USSR (deployable)',
date: '1955-11-22',
latitude: 50.07,
longitude: 78.43
},{
name: 'Tsar Bomba',
radius: 75,
yeild: 50000,
country: 'USSR',
fillKey: 'RUS',
significance: 'Largest thermonuclear weapon ever tested—scaled down from its initial 100 Mt design by 50%',
date: '1961-10-31',
latitude: 73.482,
longitude: 54.5854
}
];
//draw bubbles for bombs
bombMap.bubbles(bombs, {
popupTemplate: function (geo, data) {
return ['' + data.name,
'
Payload: ' + data.yeild + ' kilotons',
'
Country: ' + data.country + '',
'
Date: ' + data.date + '',
'
'].join('');
}
});
```
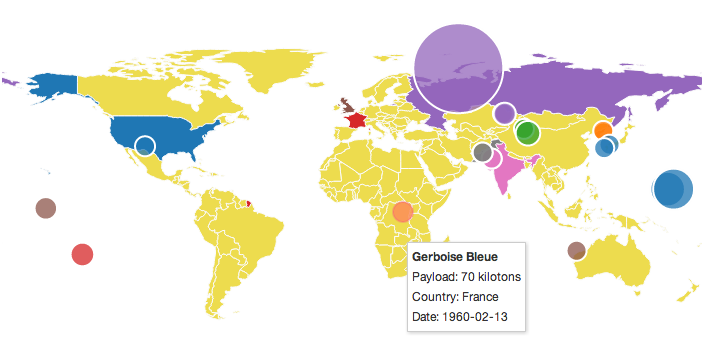
The first parameter to `bubbles` should be an array of objects, each with **at least** 3 properties:
- `latitude`
- `longitude`
- `radius`
Optionally, pass in `fillKey` to color code the bubble, and pass in any other data you want to render in a popup template which can be overridden in the options parameter.
For further customization, you can set these properties on each bubble to override the options parameter (or default options):
- `borderColor`
- `borderWidth`
- `fillOpacity`
The second parameter is the `options` param, where you can overide any of the default options (documented below)
#### Live updating of bubbles
You can continue to call `bubbles` on the same map instance and the map will auto update itself. Any bubble previously drawn that's **not included** in subsequent calls will be removed from the UI.
`map.bubbles([])` will erase all bubbles.
#### Labels
For USA maps you can add 2 letter (*i.e., NY, TX*) labels to each state. To add labels, after created the map:
```javascript
map.labels();
```
The following options are allowed:
- `labelColor` //font color, default: #000
- `lineWidth` //line width for New England states, default: 1
- `fontSize` //font size, default: 10
- `fontFamily` //font family, default: 'Verdana'
An example for using the options:
```javascript
map.labels({labelColor: 'blue', fontSize: 12});
```
#### Zooming
You can override the default projection by setting your own `setProjection(element)` function.
[Example here](http://datamaps.github.io#zoom)
```javascript
var map = new Datamap({
scope: 'world',
element: document.getElementById('container1'),
setProjection: function(element) {
var projection = d3.geo.equirectangular()
.center([19, -3])
.rotate([4.4, 0])
.scale(400)
.translate([element.offsetWidth / 2, element.offsetHeight / 2]);
var path = d3.geo.path()
.projection(projection);
return {path: path, projection: projection};
},
```
#### Using with jQuery
If jQuery is present on the page when the Datamaps library loads, it'll automatically create a jQuery plugin called `datamaps` that can be used like:
```html
```
#### Events
All events are bubbled up to the root `svg` element and to listen to events, use the `done` callback.
```html
```
---
#### Default Options
```js
{
scope: 'world', //currently supports 'usa' and 'world', however with custom map data you can specify your own
setProjection: setProjection, //returns a d3 path and projection functions
projection: 'equirectangular', //style of projection to be used. try "mercator"
done: function() {}, //callback when the map is done drawing
fills: {
defaultFill: '#ABDDA4' //the keys in this object map to the "fillKey" of [data] or [bubbles]
},
geographyConfig: {
dataUrl: null, //if not null, datamaps will fetch the map JSON (currently only supports topojson)
hideAntarctica: true,
borderWidth: 1,
borderColor: '#FDFDFD',
popupTemplate: function(geography, data) { //this function should just return a string
return '' + geography.properties.name + '
';
},
popupOnHover: true, //disable the popup while hovering
highlightOnHover: true,
highlightFillColor: '#FC8D59',
highlightBorderColor: 'rgba(250, 15, 160, 0.2)',
highlightBorderWidth: 2
},
bubbleConfig: {
borderWidth: 2,
borderColor: '#FFFFFF',
popupOnHover: true,
popupTemplate: function(geography, data) {
return '' + data.name + '
';
},
fillOpacity: 0.75,
highlightOnHover: true,
highlightFillColor: '#FC8D59',
highlightBorderColor: 'rgba(250, 15, 160, 0.2)',
highlightBorderWidth: 2,
highlightFillOpacity: 0.85
}
}
```
---
#Contributing Guidelines
* Do not run the `grunt build` task or submit any built files in your PR.
* Have an example in `src/examples` if adding a new feature. Copy an existing feature `.html` file to start.