# vivainsights
**Repository Path**: mirrors_microsoft/vivainsights
## Basic Information
- **Project Name**: vivainsights
- **Description**: R library to analyze and visualize data from Viva Insights Analyst Experience
- **Primary Language**: Unknown
- **License**: MIT
- **Default Branch**: main
- **Homepage**: None
- **GVP Project**: No
## Statistics
- **Stars**: 0
- **Forks**: 0
- **Created**: 2022-10-24
- **Last Updated**: 2026-05-23
## Categories & Tags
**Categories**: Uncategorized
**Tags**: None
## README
# vivainsights  [](https://github.com/microsoft/wpa/actions/)
[](https://opensource.org/license/mit)
[](https://CRAN.R-project.org/package=vivainsights/)
[](https://cran.r-project.org/package=vivainsights/)
## Overview
This is an R package for analyzing and visualizing data from [Microsoft Viva Advanced Insights](https://www.microsoft.com/en-gb/microsoft-viva/insights/) (previously Microsoft Workplace Analytics).
### With the **vivainsights** package, you can...
1. **Run prebuilt analysis and visualizations** off advanced insights data with settings for HR variables, privacy threshold, etc.
2. Leverage **advanced analytics functions** which are built for Viva Insights metrics
3. Integrate analysis of Viva Insights data with your R workflow seamlessly
This library is compatible with the latest implementation of the Viva Insights Analyst Workbench. For the R library compatible with the legacy implementation, please visit the **wpa** package [website](https://microsoft.github.io/wpa/) or [GitHub repository](https://github.com/microsoft/wpa/) .
## Installation
```r
# Install from CRAN:
install.packages("vivainsights")
# Install development version from GitHub:
pak::pak("microsoft/vivainsights")
```
## Usage
To get started with the package, please see the following links:
* [Installation and Set-up](https://microsoft.github.io/vivainsights/analyst_guide_getting_started.html)
* [Full function list](https://microsoft.github.io/vivainsights/reference/index.html)
* [Analyst Guide](https://microsoft.github.io/vivainsights/analyst_guide_intro.html)
### Privacy threshold with `mingroup`
Most plotting and analysis functions support the `mingroup` argument (default:
`5`) to suppress very small groups for privacy and readability.
```r
data("pq_data")
# Check available HR variables and how many groups they have
pq_data %>%
hrvar_count_all(return = "table")
# Set a higher threshold when plotting
pq_data %>%
meeting_trend(hrvar = "Organization", mingroup = 10, return = "plot")
```
## Cheatsheet
Also check out our package cheat sheet for a quick glimpse of what **vivainsights** offers:
[](https://github.com/microsoft/wpa/actions/)
[](https://opensource.org/license/mit)
[](https://CRAN.R-project.org/package=vivainsights/)
[](https://cran.r-project.org/package=vivainsights/)
## Overview
This is an R package for analyzing and visualizing data from [Microsoft Viva Advanced Insights](https://www.microsoft.com/en-gb/microsoft-viva/insights/) (previously Microsoft Workplace Analytics).
### With the **vivainsights** package, you can...
1. **Run prebuilt analysis and visualizations** off advanced insights data with settings for HR variables, privacy threshold, etc.
2. Leverage **advanced analytics functions** which are built for Viva Insights metrics
3. Integrate analysis of Viva Insights data with your R workflow seamlessly
This library is compatible with the latest implementation of the Viva Insights Analyst Workbench. For the R library compatible with the legacy implementation, please visit the **wpa** package [website](https://microsoft.github.io/wpa/) or [GitHub repository](https://github.com/microsoft/wpa/) .
## Installation
```r
# Install from CRAN:
install.packages("vivainsights")
# Install development version from GitHub:
pak::pak("microsoft/vivainsights")
```
## Usage
To get started with the package, please see the following links:
* [Installation and Set-up](https://microsoft.github.io/vivainsights/analyst_guide_getting_started.html)
* [Full function list](https://microsoft.github.io/vivainsights/reference/index.html)
* [Analyst Guide](https://microsoft.github.io/vivainsights/analyst_guide_intro.html)
### Privacy threshold with `mingroup`
Most plotting and analysis functions support the `mingroup` argument (default:
`5`) to suppress very small groups for privacy and readability.
```r
data("pq_data")
# Check available HR variables and how many groups they have
pq_data %>%
hrvar_count_all(return = "table")
# Set a higher threshold when plotting
pq_data %>%
meeting_trend(hrvar = "Organization", mingroup = 10, return = "plot")
```
## Cheatsheet
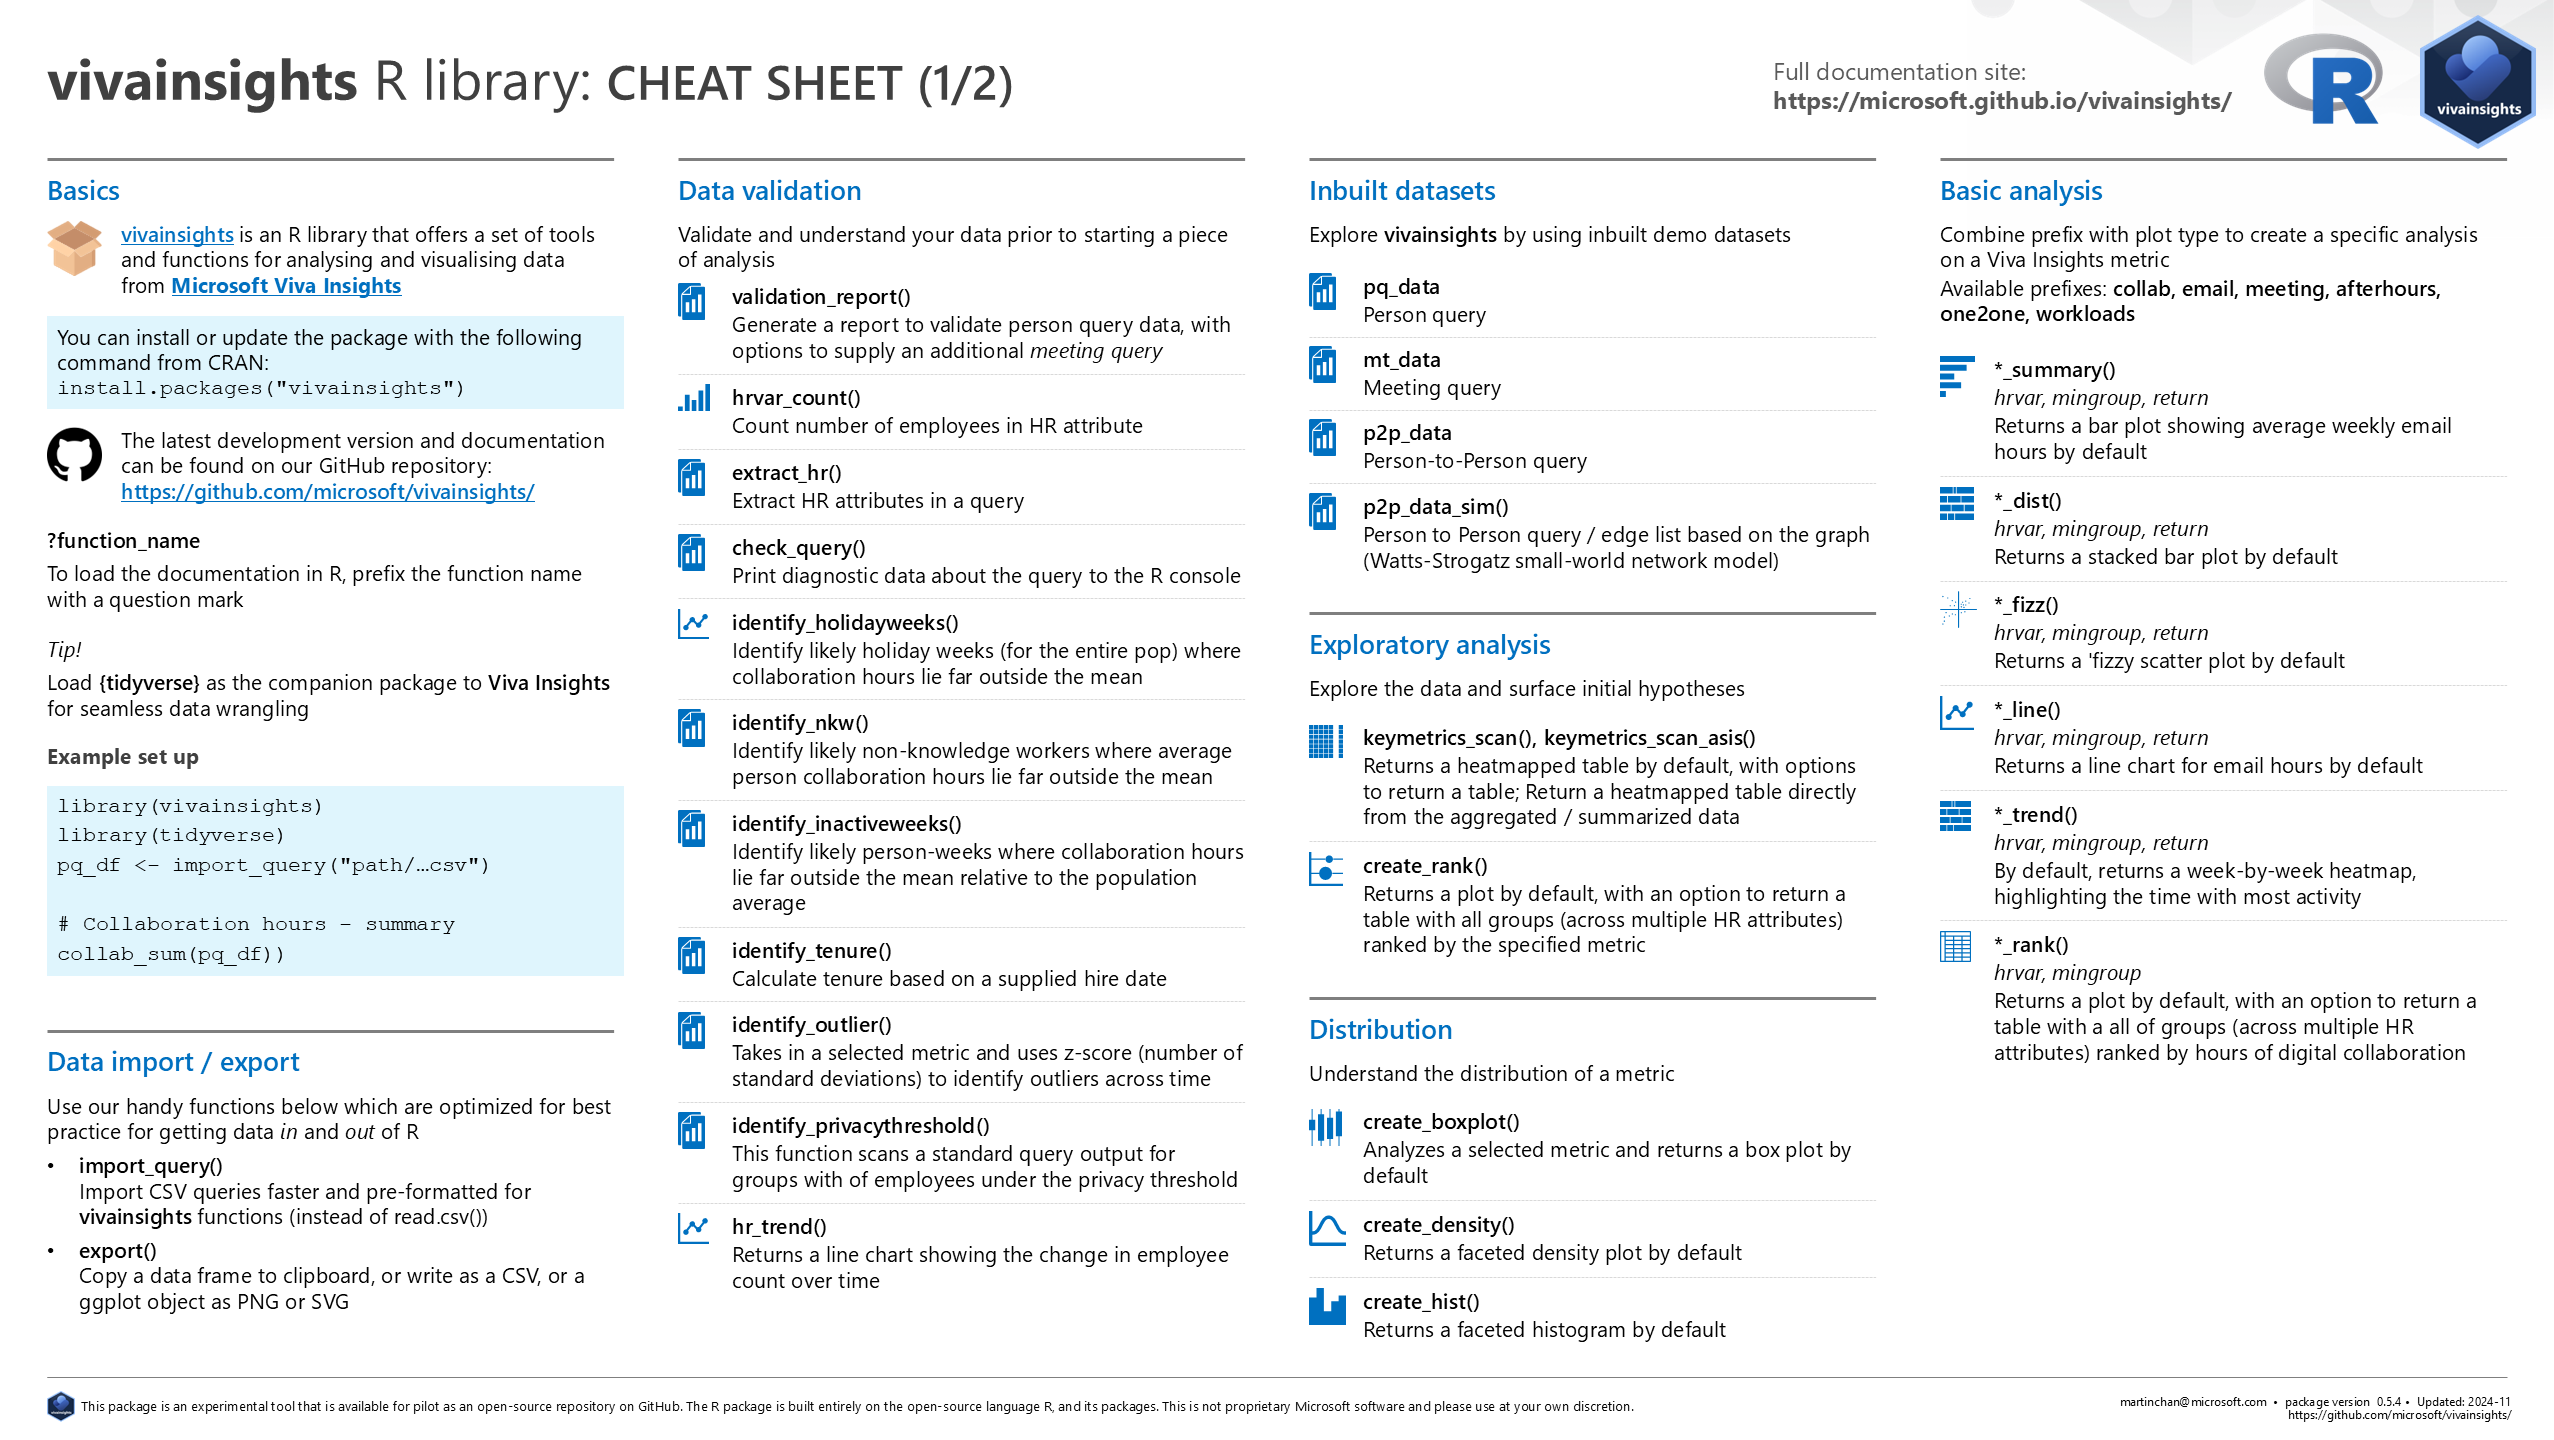
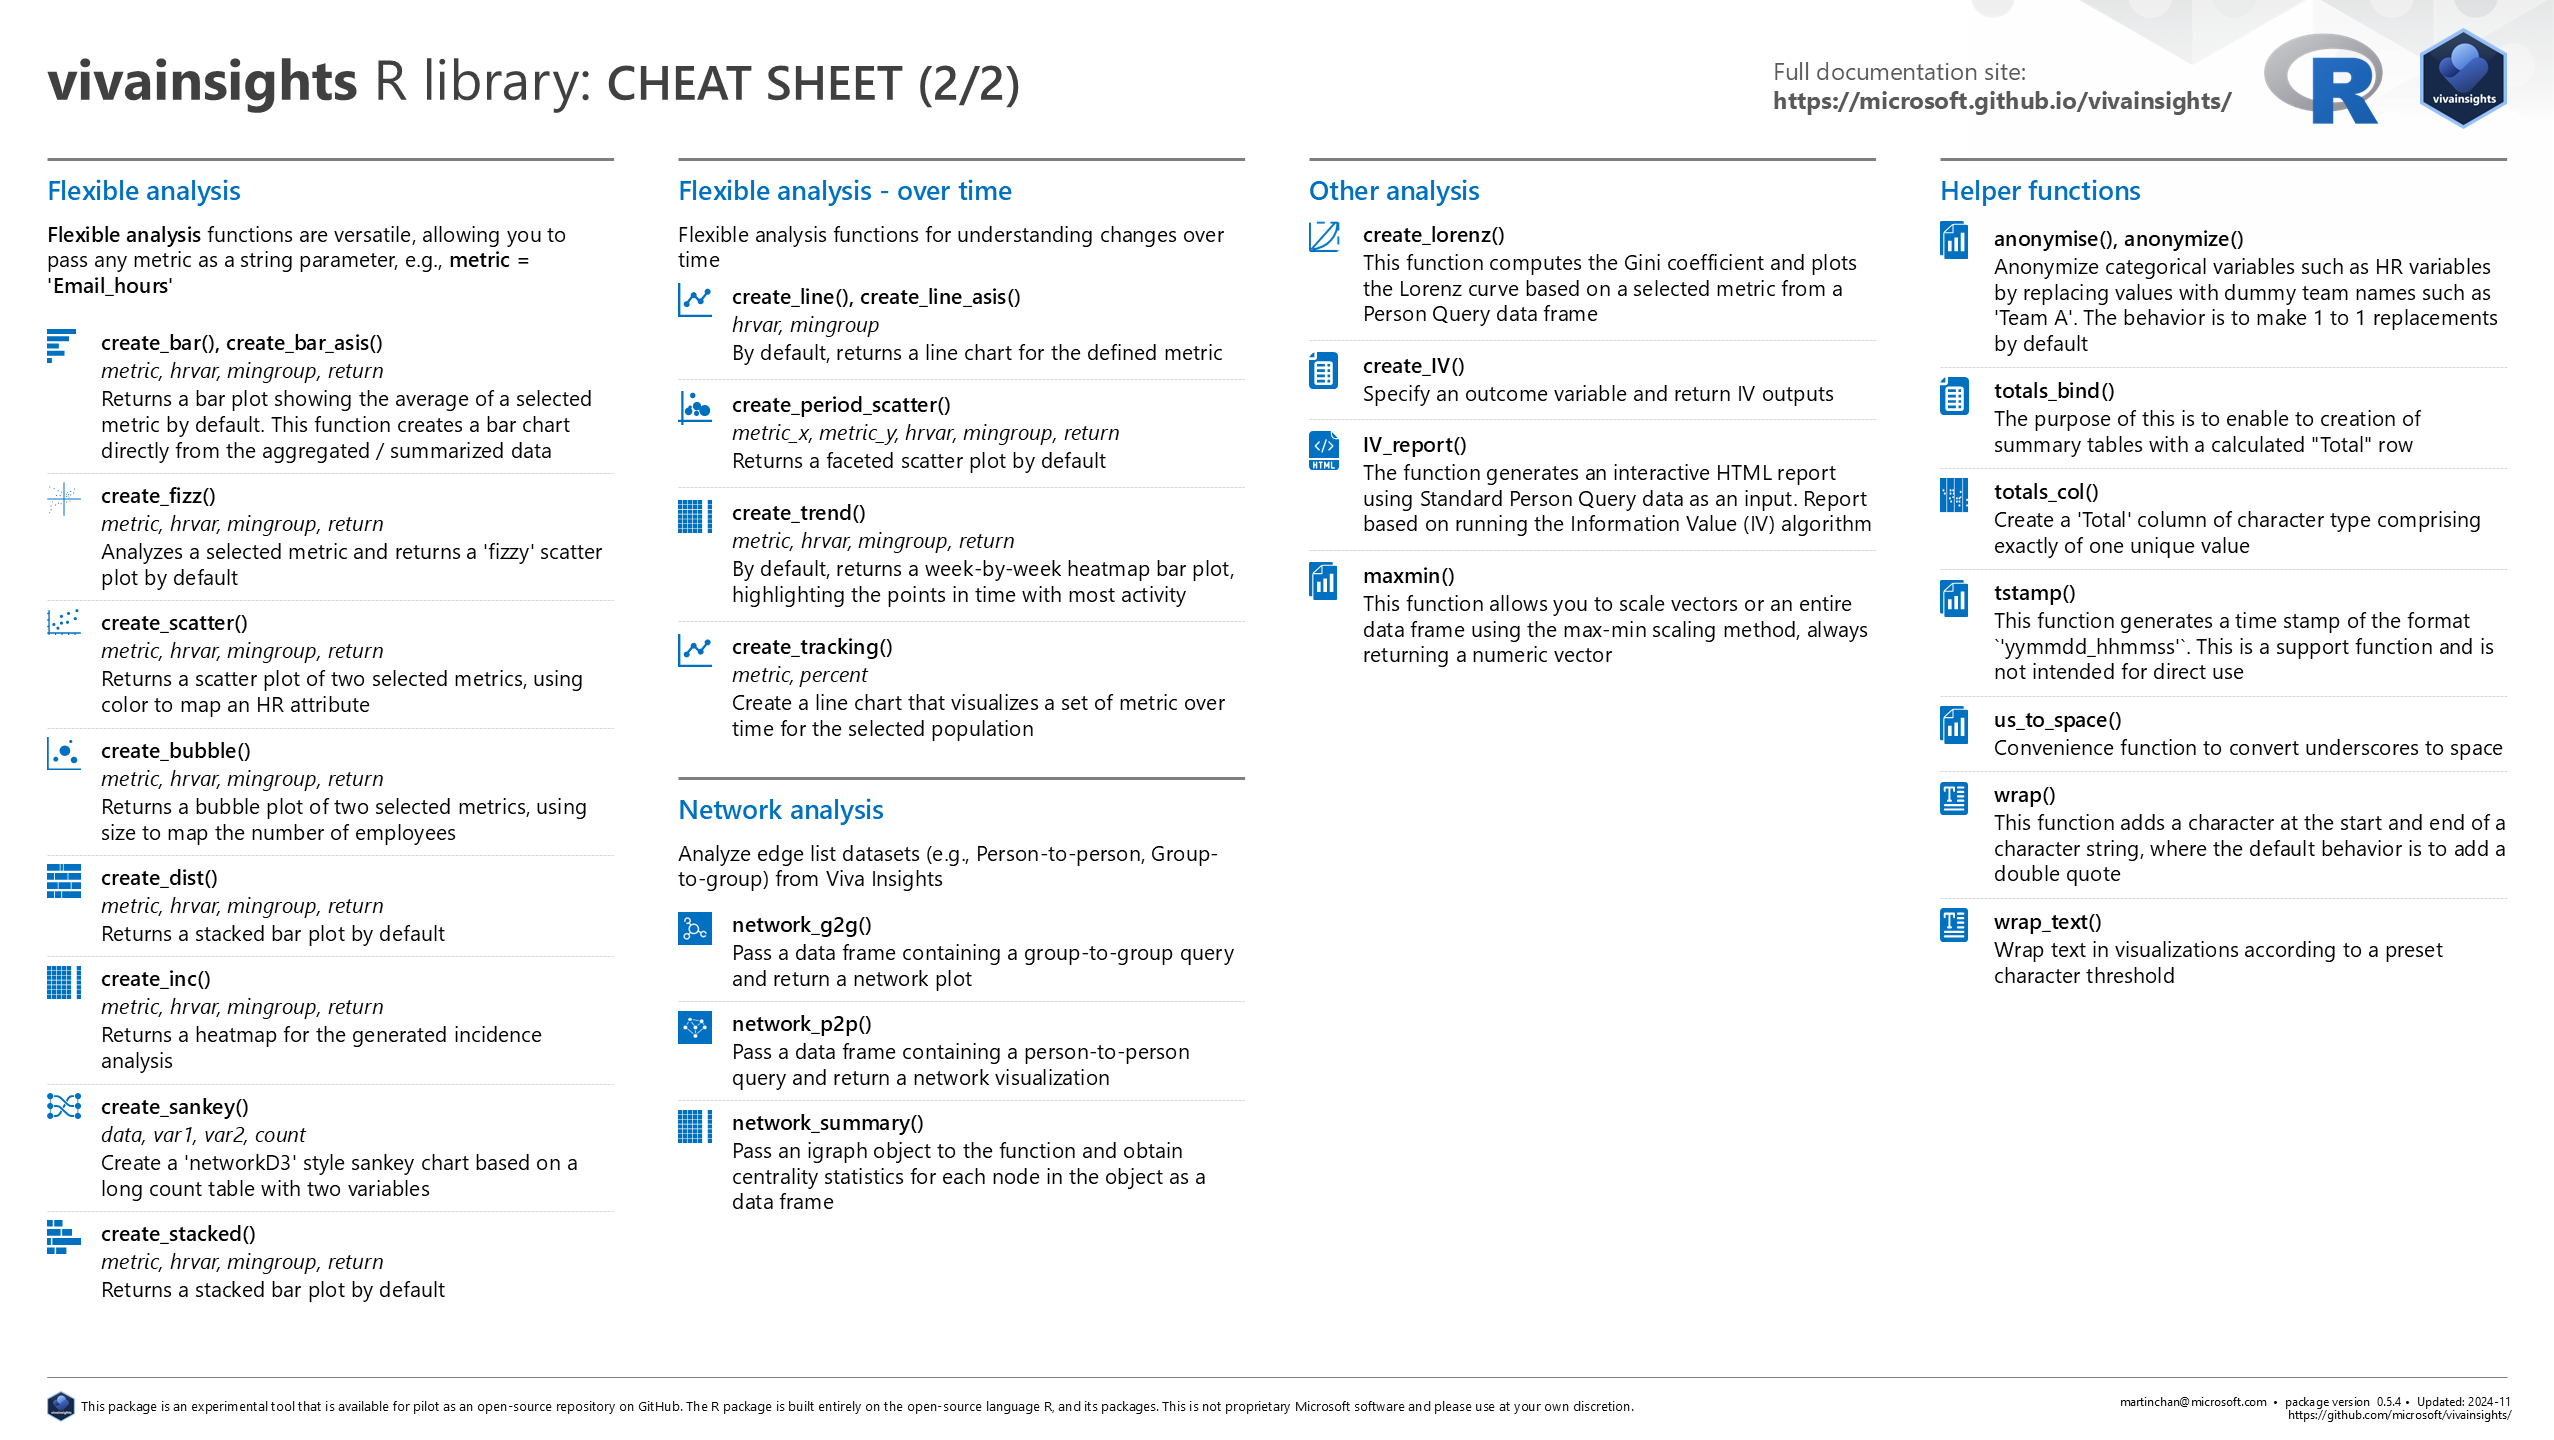
Also check out our package cheat sheet for a quick glimpse of what **vivainsights** offers:
 ## Related repositories
- [Viva RMarkdown Report Marketplace](https://github.com/microsoft/VivaRMDReportMarketplace/)
- [Viva Insights Sample Code](https://github.com/microsoft/viva-insights-sample-code/)
- [Viva Insights Zoom Integration](https://github.com/microsoft/vivainsights_zoom_int/)
- [Viva Insights OData Query Download](https://github.com/microsoft/vivainsights-odatadl/)
- [Viva Insights R library (legacy)](https://microsoft.github.io/wpa/)
- [Viva Insights Python library](https://github.com/microsoft/vivainsights-py/)
---
## Code of Conduct
We would ask you to please read the [Microsoft Open Source Code of Conduct](https://opensource.microsoft.com/codeofconduct/) prior to engaging with this package.
**Trademarks**
This project may contain trademarks or logos for projects, products, or services. Authorized use of Microsoft trademarks or logos is subject to and must follow [Microsoft's Trademark & Brand Guidelines](https://www.microsoft.com/en-us/legal/intellectualproperty/trademarks/). Use of Microsoft trademarks or logos in modified versions of this project must not cause confusion or imply Microsoft sponsorship. Any use of third-party trademarks or logos are subject to those third-party's policies.
---
## Finding this project useful?
:star: Please star this repository to keep us going!
## Related repositories
- [Viva RMarkdown Report Marketplace](https://github.com/microsoft/VivaRMDReportMarketplace/)
- [Viva Insights Sample Code](https://github.com/microsoft/viva-insights-sample-code/)
- [Viva Insights Zoom Integration](https://github.com/microsoft/vivainsights_zoom_int/)
- [Viva Insights OData Query Download](https://github.com/microsoft/vivainsights-odatadl/)
- [Viva Insights R library (legacy)](https://microsoft.github.io/wpa/)
- [Viva Insights Python library](https://github.com/microsoft/vivainsights-py/)
---
## Code of Conduct
We would ask you to please read the [Microsoft Open Source Code of Conduct](https://opensource.microsoft.com/codeofconduct/) prior to engaging with this package.
**Trademarks**
This project may contain trademarks or logos for projects, products, or services. Authorized use of Microsoft trademarks or logos is subject to and must follow [Microsoft's Trademark & Brand Guidelines](https://www.microsoft.com/en-us/legal/intellectualproperty/trademarks/). Use of Microsoft trademarks or logos in modified versions of this project must not cause confusion or imply Microsoft sponsorship. Any use of third-party trademarks or logos are subject to those third-party's policies.
---
## Finding this project useful?
:star: Please star this repository to keep us going!