# pretty-print-confusion-matrix
**Repository Path**: mirrors_wcipriano/pretty-print-confusion-matrix
## Basic Information
- **Project Name**: pretty-print-confusion-matrix
- **Description**: Confusion Matrix in Python: plot a pretty confusion matrix (like Matlab) in python using seaborn and matplotlib
- **Primary Language**: Unknown
- **License**: Apache-2.0
- **Default Branch**: master
- **Homepage**: None
- **GVP Project**: No
## Statistics
- **Stars**: 0
- **Forks**: 0
- **Created**: 2022-01-11
- **Last Updated**: 2026-04-13
## Categories & Tags
**Categories**: Uncategorized
**Tags**: None
## README


# Confusion Matrix in Python
Plot a pretty confusion matrix (like Matlab) in python using seaborn and matplotlib.
This module get a pretty print confusion matrix from a NumPy matrix or from 2 NumPy arrays (`y_test` and `predictions`).
## Become a sponsor
Please, consider contributing it to the project.
Support the developers who power open source!
Invest in open source. It powers your world.
Become a sponsor now!
If my open source projects could bring you closer to your goals and you want to say thank you, and you can contribute, feel free to do [Buy me a ☕](https://buymeacoffee.com/wcipriano) !
Or Become a sponsor directly on [GitHub sponsors page](https://github.com/sponsors/wcipriano?frequency=recurring&) !
You will receive a **sponsor badge** on your profile.
I will be really thankfull for anything even if it is a coffee or just a kind comment towards my work, because that helps me a lot.
See my projects and my contacts in my [Linktree](https://linktr.ee/wagner.cipriano) if you want to stay connected!
## Installation
```bash
pip install pretty-confusion-matrix
```
## Get Started
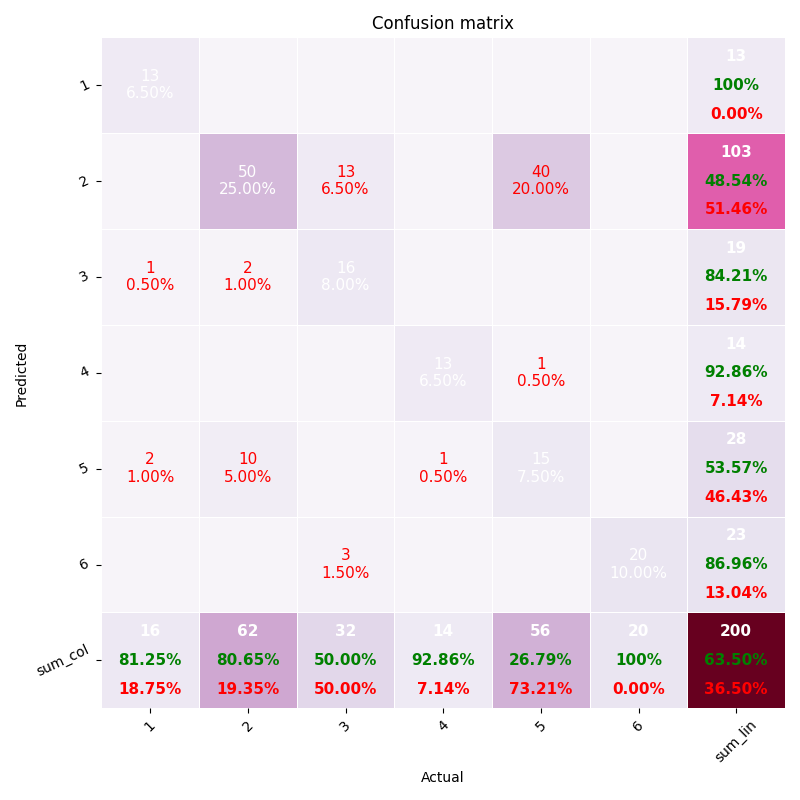
### Plotting from DataFrame:
```python
import numpy as np
import pandas as pd
from pretty_confusion_matrix import pp_matrix
array = np.array([[13, 0, 1, 0, 2, 0],
[0, 50, 2, 0, 10, 0],
[0, 13, 16, 0, 0, 3],
[0, 0, 0, 13, 1, 0],
[0, 40, 0, 1, 15, 0],
[0, 0, 0, 0, 0, 20]])
# get pandas dataframe
df_cm = pd.DataFrame(array, index=range(1, 7), columns=range(1, 7))
# colormap: see this and choose your more dear
cmap = 'PuRd'
pp_matrix(df_cm, cmap=cmap)
```
### Plotting from vectors
```python
import numpy as np
from pretty_confusion_matrix import pp_matrix_from_data
y_test = np.array([1, 2, 3, 4, 5, 1, 2, 3, 4, 5, 1, 2, 3, 4, 5, 1, 2, 3, 4, 5, 1, 2, 3, 4, 5, 1, 2, 3, 4, 5, 1, 2, 3, 4, 5, 1, 2, 3, 4, 5, 1, 2, 3, 4, 5, 1, 2, 3, 4, 5, 1, 2,
3, 4, 5, 1, 2, 3, 4, 5, 1, 2, 3, 4, 5, 1, 2, 3, 4, 5, 1, 2, 3, 4, 5, 1, 2, 3, 4, 5, 1, 2, 3, 4, 5, 1, 2, 3, 4, 5, 1, 2, 3, 4, 5, 1, 2, 3, 4, 5, 1, 2, 3, 4, 5, 1, 2, 3, 4, 5])
predic = np.array([1, 2, 4, 3, 5, 1, 2, 4, 3, 5, 1, 2, 3, 4, 4, 1, 4, 3, 4, 5, 1, 2, 4, 4, 5, 1, 2, 4, 4, 5, 1, 2, 4, 4, 5, 1, 2, 4, 4, 5, 1, 2, 3, 3, 5, 1, 2, 3, 3, 5, 1, 2,
3, 4, 4, 1, 2, 3, 4, 1, 1, 2, 3, 4, 1, 1, 2, 3, 4, 1, 1, 2, 4, 4, 5, 1, 2, 4, 4, 5, 1, 2, 4, 4, 5, 1, 2, 4, 4, 5, 1, 2, 3, 4, 5, 1, 2, 3, 4, 5, 1, 2, 3, 4, 5, 1, 2, 3, 4, 5])
pp_matrix_from_data(y_test, predic)
```
## Using custom labels in axis
You can customize the labels in axis, whether by DataFrame or vectors.
### From DataFrame
To plot the matrix with text labels in axis rather than integer, change the params `index` and `columns` of your dataframe.
Getting the example one above, just change the line `df_cm = pd.DataFrame(array, index=range(1, 7), columns=range(1, 7))` by
```python
col = ['Dog', 'Cat', 'Mouse', 'Fox', 'Bird', 'Chicken']
df_cm = pd.DataFrame(array, index=col, columns=col)
```
It'll replace the integer labels (**1...6**) in the axis, by **Dog, Cat, Mouse**, and so on..
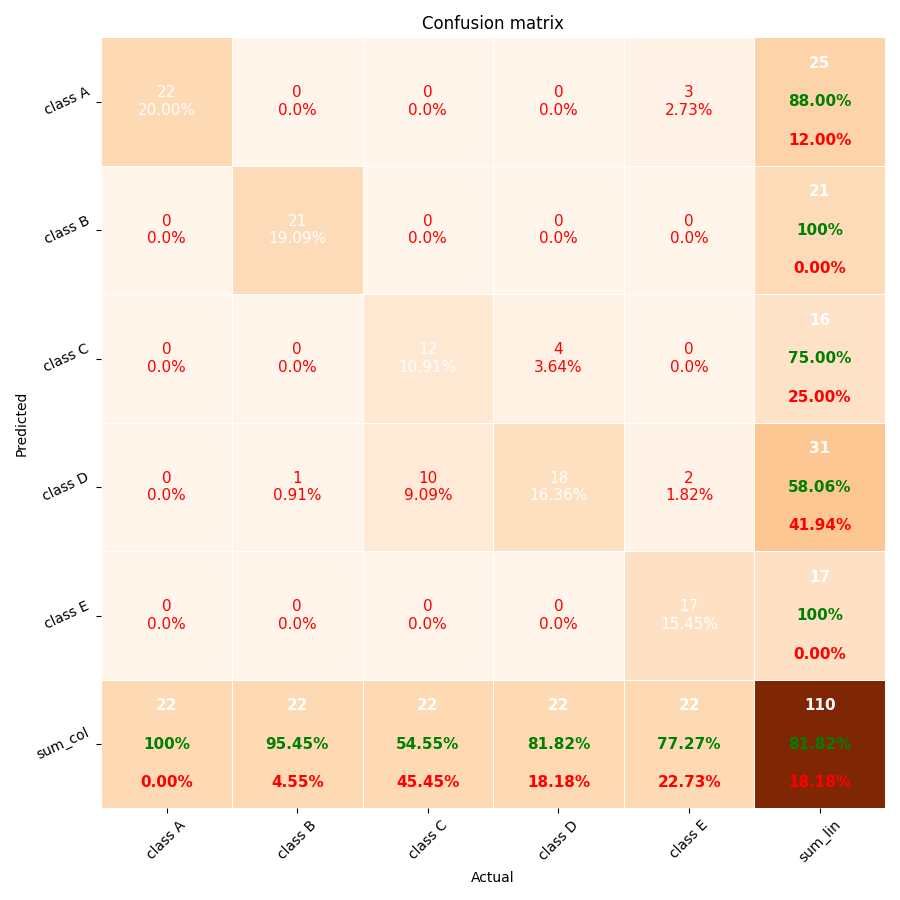
### From vectors
It's very similar, in this case you just need to use the `columns` param like the example below.
This param is a positional array, i.e., the order must be the same of the data representation.
In this example _Dog_ will be assigned to the class 0, _Cat_ will be assigned to the class 1, and so on and so forth.
Getting the example two above, just change the line `pp_matrix_from_data(y_test, predic)`, by
```python
columns = ['Dog', 'Cat', 'Mouse', 'Fox', 'Bird']
pp_matrix_from_data(y_test, predic, columns)
```
It'll replace "class A, ..., class E" in the axis, by **Dog, Cat, ..., Bird**.
More information about "_How to plot confusion matrix with string axis rather than integer in python_" in [this Stackoverflow answer](https://stackoverflow.com/a/51176855/1809554).
## Choosing Colormaps
You can choose the layout of the your matrix by a lot of colors options like PuRd, Oranges and more...
To customizer your color scheme, use the param cmap of funcion pp_matrix.
To see all the colormap available, please do this:
```python
from matplotlib import colormaps
list(colormaps)
```
More information about Choosing Colormaps in Matplotlib is available [here](https://matplotlib.org/stable/users/explain/colors/colormaps.html).
## References:
### 1. MATLAB confusion matrix:
a) [Plot Confusion](https://www.mathworks.com/help/nnet/ref/plotconfusion.html)
b) [Plot Confusion Matrix Using Categorical Labels](https://www.mathworks.com/help/examples/nnet/win64/PlotConfusionMatrixUsingCategoricalLabelsExample_02.png)
### 2. Examples and more on Python:
a) [How to plot confusion matrix with string axis rather than integer in python](https://stackoverflow.com/questions/5821125/how-to-plot-confusion-matrix-with-string-axis-rather-than-integer-in-python/51176855#51176855)
b) [Plot-scikit-learn-classification-report](https://stackoverflow.com/questions/28200786/how-to-plot-scikit-learn-classification-report)
c) [Plot-confusion-matrix-with-string-axis-rather-than-integer-in-Python](https://stackoverflow.com/questions/5821125/how-to-plot-confusion-matrix-with-string-axis-rather-than-integer-in-python)
d) [Seaborn heatmap](https://www.programcreek.com/python/example/96197/seaborn.heatmap)
e) [Sklearn-plot-confusion-matrix-with-labels](https://stackoverflow.com/questions/19233771/sklearn-plot-confusion-matrix-with-labels/31720054)
f) [Model-selection-plot-confusion-matrix](http://scikit-learn.org/stable/auto_examples/model_selection/plot_confusion_matrix.html#sphx-glr-auto-examples-model-selection-plot-confusion-matrix-py)

# Confusion Matrix in Python
Plot a pretty confusion matrix (like Matlab) in python using seaborn and matplotlib.
This module get a pretty print confusion matrix from a NumPy matrix or from 2 NumPy arrays (`y_test` and `predictions`).
## Become a sponsor
Please, consider contributing it to the project.
Support the developers who power open source!
Invest in open source. It powers your world.
Become a sponsor now!
If my open source projects could bring you closer to your goals and you want to say thank you, and you can contribute, feel free to do [Buy me a ☕](https://buymeacoffee.com/wcipriano) !
Or Become a sponsor directly on [GitHub sponsors page](https://github.com/sponsors/wcipriano?frequency=recurring&) !
You will receive a **sponsor badge** on your profile.
I will be really thankfull for anything even if it is a coffee or just a kind comment towards my work, because that helps me a lot.
See my projects and my contacts in my [Linktree](https://linktr.ee/wagner.cipriano) if you want to stay connected!
## Installation
```bash
pip install pretty-confusion-matrix
```
## Get Started
### Plotting from DataFrame:
```python
import numpy as np
import pandas as pd
from pretty_confusion_matrix import pp_matrix
array = np.array([[13, 0, 1, 0, 2, 0],
[0, 50, 2, 0, 10, 0],
[0, 13, 16, 0, 0, 3],
[0, 0, 0, 13, 1, 0],
[0, 40, 0, 1, 15, 0],
[0, 0, 0, 0, 0, 20]])
# get pandas dataframe
df_cm = pd.DataFrame(array, index=range(1, 7), columns=range(1, 7))
# colormap: see this and choose your more dear
cmap = 'PuRd'
pp_matrix(df_cm, cmap=cmap)
```

### Plotting from vectors
```python
import numpy as np
from pretty_confusion_matrix import pp_matrix_from_data
y_test = np.array([1, 2, 3, 4, 5, 1, 2, 3, 4, 5, 1, 2, 3, 4, 5, 1, 2, 3, 4, 5, 1, 2, 3, 4, 5, 1, 2, 3, 4, 5, 1, 2, 3, 4, 5, 1, 2, 3, 4, 5, 1, 2, 3, 4, 5, 1, 2, 3, 4, 5, 1, 2,
3, 4, 5, 1, 2, 3, 4, 5, 1, 2, 3, 4, 5, 1, 2, 3, 4, 5, 1, 2, 3, 4, 5, 1, 2, 3, 4, 5, 1, 2, 3, 4, 5, 1, 2, 3, 4, 5, 1, 2, 3, 4, 5, 1, 2, 3, 4, 5, 1, 2, 3, 4, 5, 1, 2, 3, 4, 5])
predic = np.array([1, 2, 4, 3, 5, 1, 2, 4, 3, 5, 1, 2, 3, 4, 4, 1, 4, 3, 4, 5, 1, 2, 4, 4, 5, 1, 2, 4, 4, 5, 1, 2, 4, 4, 5, 1, 2, 4, 4, 5, 1, 2, 3, 3, 5, 1, 2, 3, 3, 5, 1, 2,
3, 4, 4, 1, 2, 3, 4, 1, 1, 2, 3, 4, 1, 1, 2, 3, 4, 1, 1, 2, 4, 4, 5, 1, 2, 4, 4, 5, 1, 2, 4, 4, 5, 1, 2, 4, 4, 5, 1, 2, 3, 4, 5, 1, 2, 3, 4, 5, 1, 2, 3, 4, 5, 1, 2, 3, 4, 5])
pp_matrix_from_data(y_test, predic)
```

## Using custom labels in axis
You can customize the labels in axis, whether by DataFrame or vectors.
### From DataFrame
To plot the matrix with text labels in axis rather than integer, change the params `index` and `columns` of your dataframe.
Getting the example one above, just change the line `df_cm = pd.DataFrame(array, index=range(1, 7), columns=range(1, 7))` by
```python
col = ['Dog', 'Cat', 'Mouse', 'Fox', 'Bird', 'Chicken']
df_cm = pd.DataFrame(array, index=col, columns=col)
```
It'll replace the integer labels (**1...6**) in the axis, by **Dog, Cat, Mouse**, and so on..
### From vectors
It's very similar, in this case you just need to use the `columns` param like the example below.
This param is a positional array, i.e., the order must be the same of the data representation.
In this example _Dog_ will be assigned to the class 0, _Cat_ will be assigned to the class 1, and so on and so forth.
Getting the example two above, just change the line `pp_matrix_from_data(y_test, predic)`, by
```python
columns = ['Dog', 'Cat', 'Mouse', 'Fox', 'Bird']
pp_matrix_from_data(y_test, predic, columns)
```
It'll replace "class A, ..., class E" in the axis, by **Dog, Cat, ..., Bird**.
More information about "_How to plot confusion matrix with string axis rather than integer in python_" in [this Stackoverflow answer](https://stackoverflow.com/a/51176855/1809554).
## Choosing Colormaps
You can choose the layout of the your matrix by a lot of colors options like PuRd, Oranges and more...
To customizer your color scheme, use the param cmap of funcion pp_matrix.
To see all the colormap available, please do this:
```python
from matplotlib import colormaps
list(colormaps)
```
More information about Choosing Colormaps in Matplotlib is available [here](https://matplotlib.org/stable/users/explain/colors/colormaps.html).
## References:
### 1. MATLAB confusion matrix:
a) [Plot Confusion](https://www.mathworks.com/help/nnet/ref/plotconfusion.html)
b) [Plot Confusion Matrix Using Categorical Labels](https://www.mathworks.com/help/examples/nnet/win64/PlotConfusionMatrixUsingCategoricalLabelsExample_02.png)
### 2. Examples and more on Python:
a) [How to plot confusion matrix with string axis rather than integer in python](https://stackoverflow.com/questions/5821125/how-to-plot-confusion-matrix-with-string-axis-rather-than-integer-in-python/51176855#51176855)
b) [Plot-scikit-learn-classification-report](https://stackoverflow.com/questions/28200786/how-to-plot-scikit-learn-classification-report)
c) [Plot-confusion-matrix-with-string-axis-rather-than-integer-in-Python](https://stackoverflow.com/questions/5821125/how-to-plot-confusion-matrix-with-string-axis-rather-than-integer-in-python)
d) [Seaborn heatmap](https://www.programcreek.com/python/example/96197/seaborn.heatmap)
e) [Sklearn-plot-confusion-matrix-with-labels](https://stackoverflow.com/questions/19233771/sklearn-plot-confusion-matrix-with-labels/31720054)
f) [Model-selection-plot-confusion-matrix](http://scikit-learn.org/stable/auto_examples/model_selection/plot_confusion_matrix.html#sphx-glr-auto-examples-model-selection-plot-confusion-matrix-py)