# CNVpytor
**Repository Path**: pengjunchu/CNVpytor
## Basic Information
- **Project Name**: CNVpytor
- **Description**: No description available
- **Primary Language**: Unknown
- **License**: MIT
- **Default Branch**: master
- **Homepage**: None
- **GVP Project**: No
## Statistics
- **Stars**: 0
- **Forks**: 0
- **Created**: 2021-10-28
- **Last Updated**: 2021-10-28
## Categories & Tags
**Categories**: Uncategorized
**Tags**: None
## README

[3D printable CNVpytor logo (stl file)](https://github.com/abyzovlab/CNVpytor/blob/master/imgs/CNVpytor.stl)
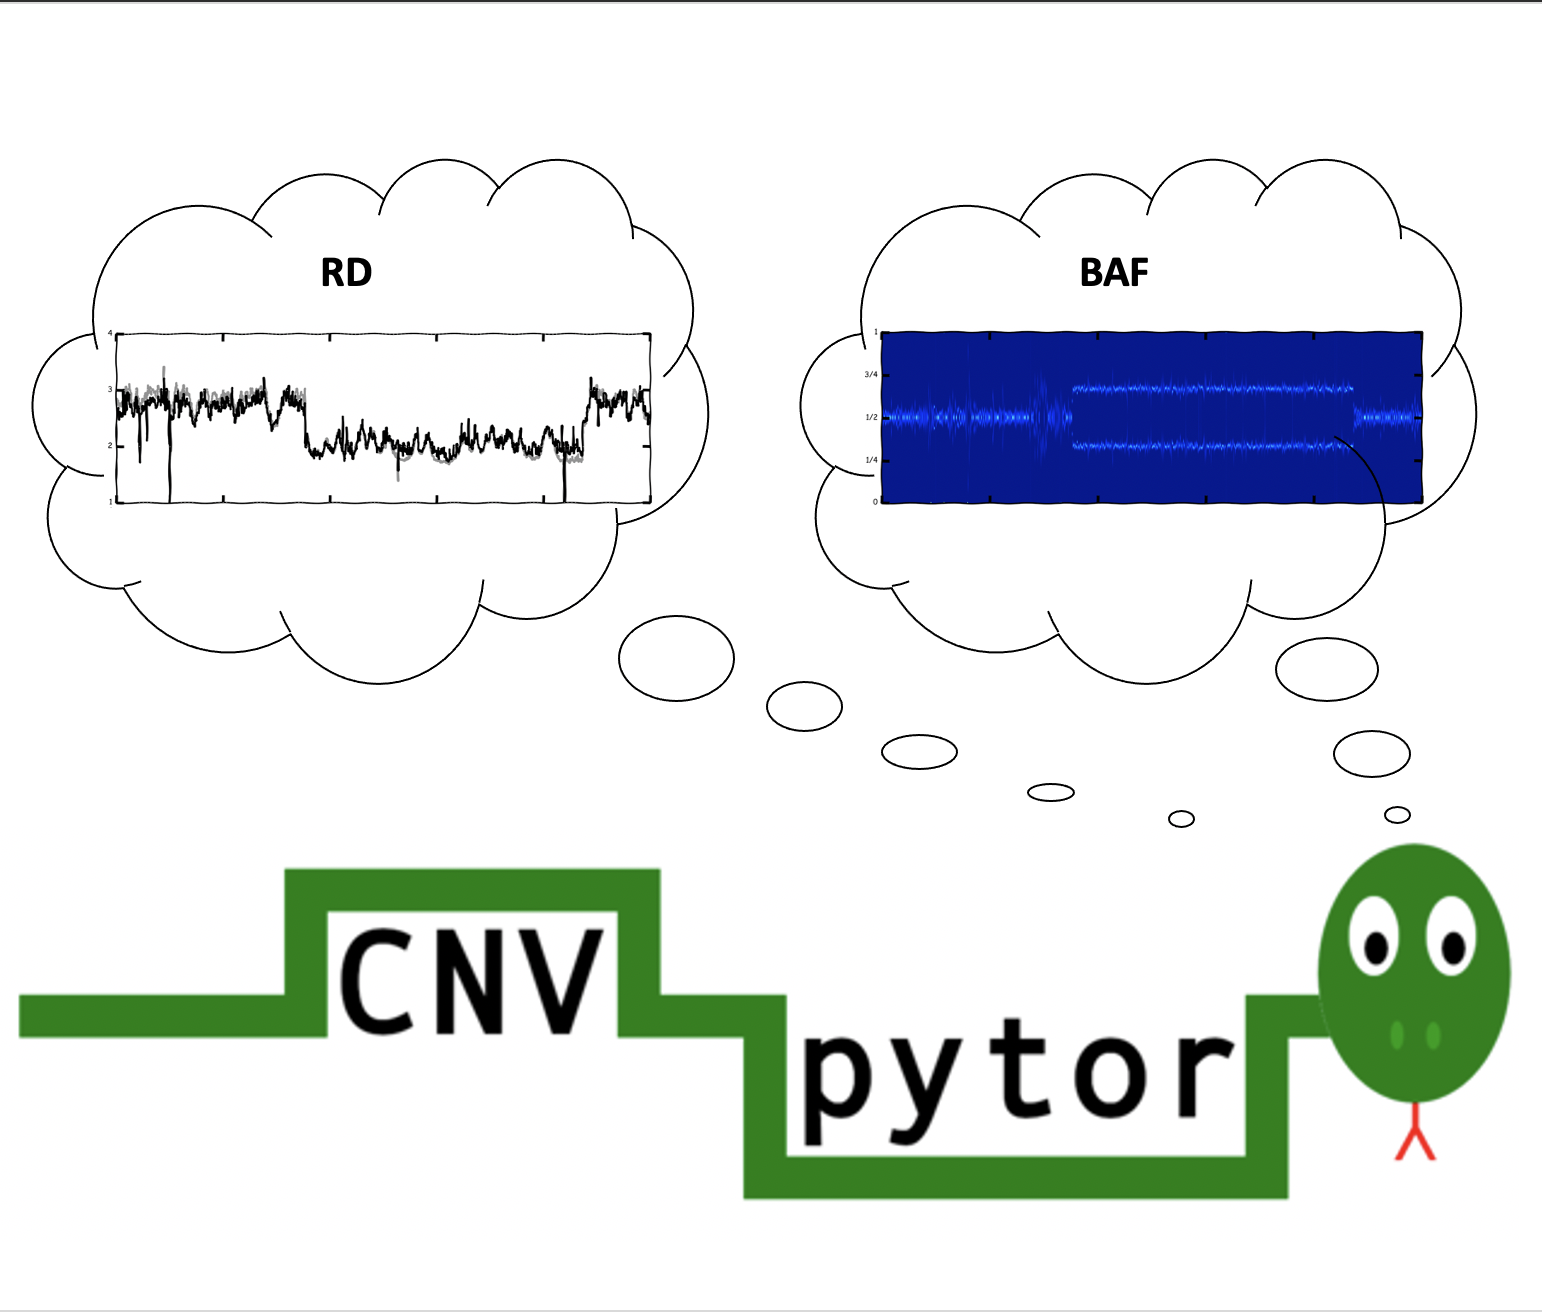
# CNVpytor - a python extension of CNVnator
CNVpytor is a Python package and command line tool for CNV/CNA analysis from depth-of-coverage by mapped reads developed in Abyzov Lab, Mayo Clinic.
Follow [CNVpytor Twitter account](https://twitter.com/cnvpytor).
**NEW: CNVpytor paper on BioRxiv:**
* CNVpytor: a tool for CNV/CNA detection and analysis from read depth and allele imbalance in whole genome sequencing, Milovan Suvakov, Arijit Panda, Colin Diesh, Ian Holmes, Alexej Abyzov
[doi: https://doi.org/10.1101/2021.01.27.428472](https://www.biorxiv.org/content/10.1101/2021.01.27.428472v1)
## Learn how to use CNVpytor in 10 minutes
* [Geting started](GettingStarted.md) with command line interface
* [Jupyter notebook](examples/PythonLibraryGuide.ipynb): How to use CNVpytor from Python
* [Google Colab](examples/Colab.ipynb): With CEPH trio example dataset
* [Video Tutorial](https://www.youtube.com/watch?v=RJMQtrD0SuE): 3-minute YT demo
## Gallery
| | |
|---|---|
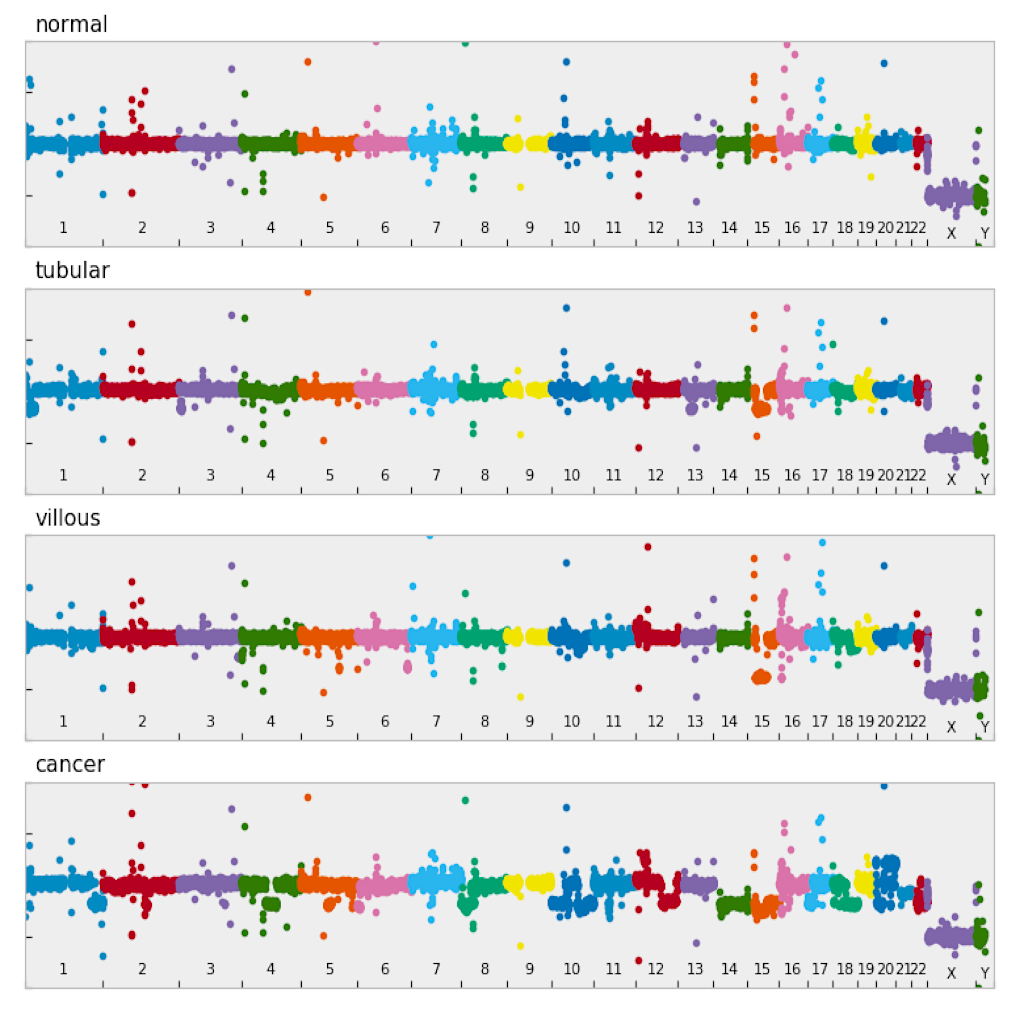
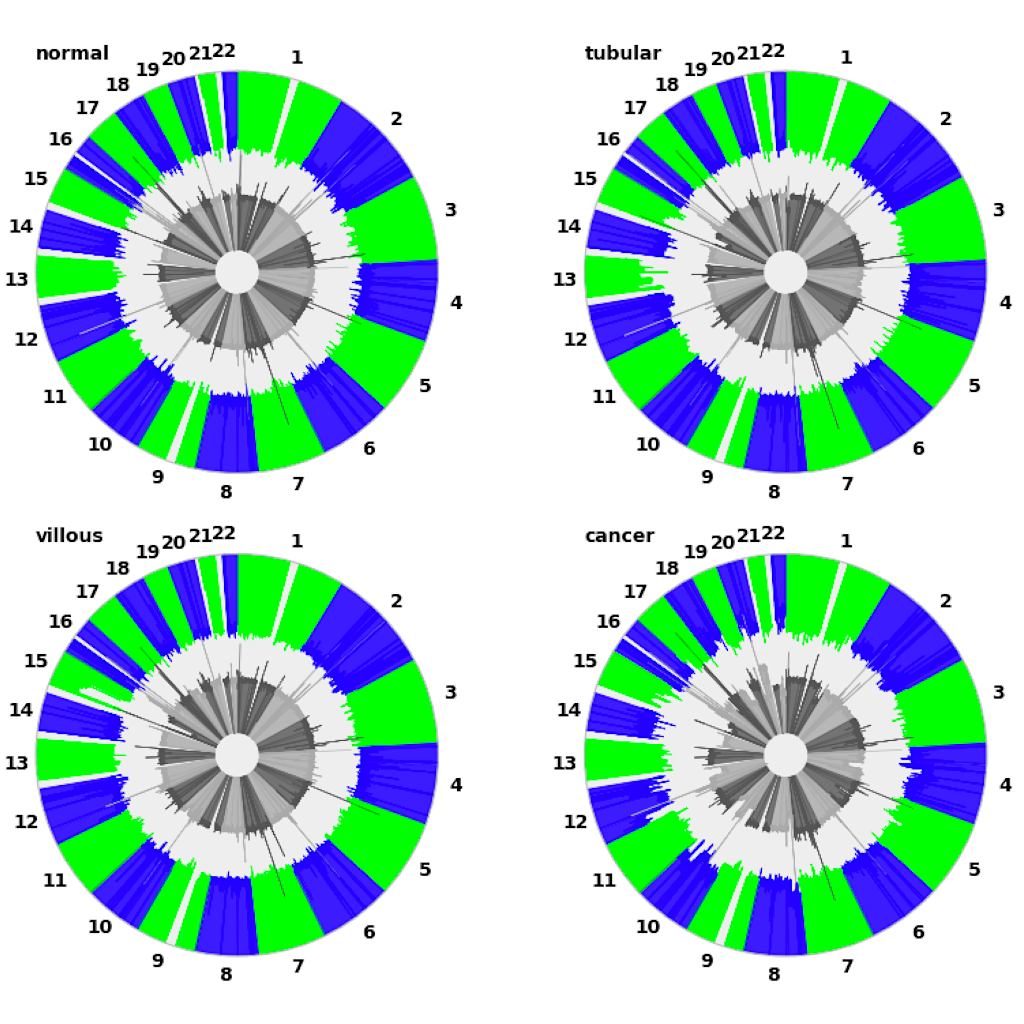
| Manhattan plot ([see example](examples/manhattan.md))| Circular plot ([see example](examples/circular.md))|
| |
| |
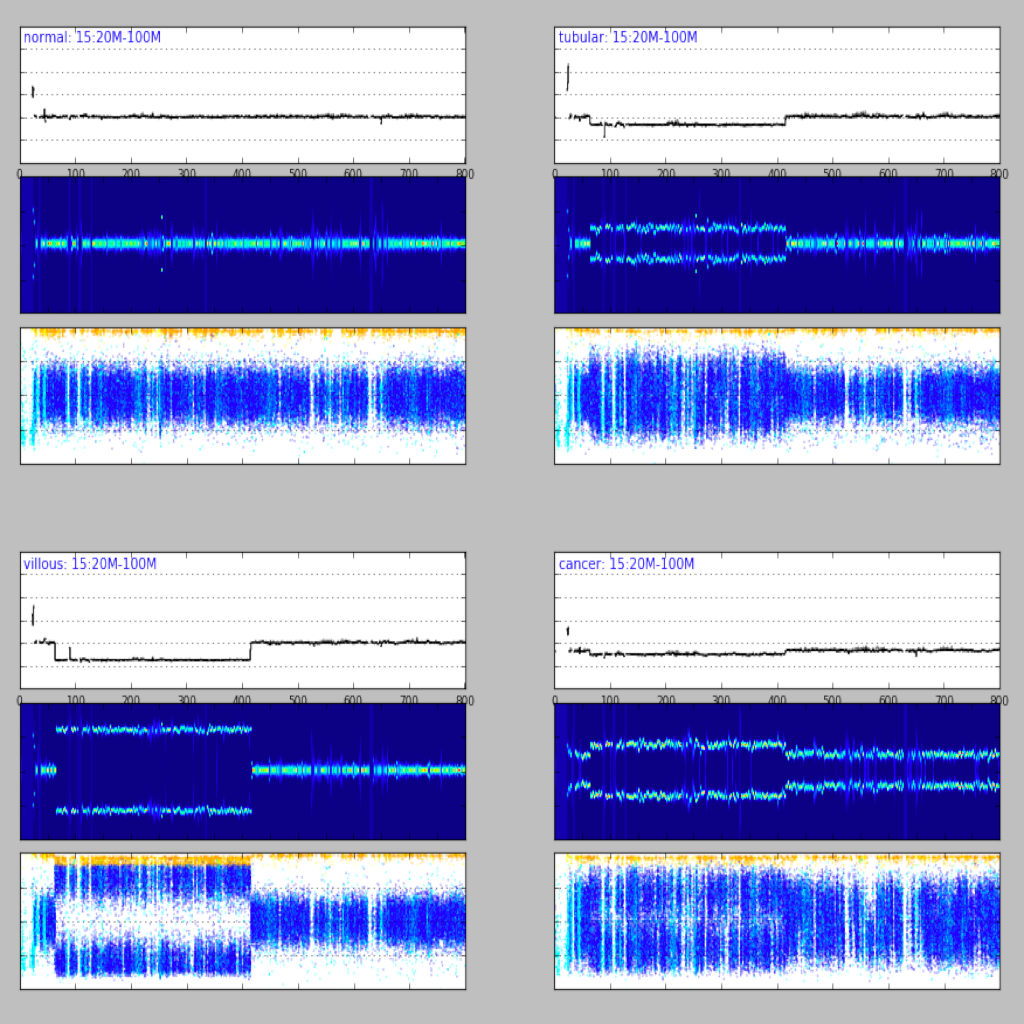
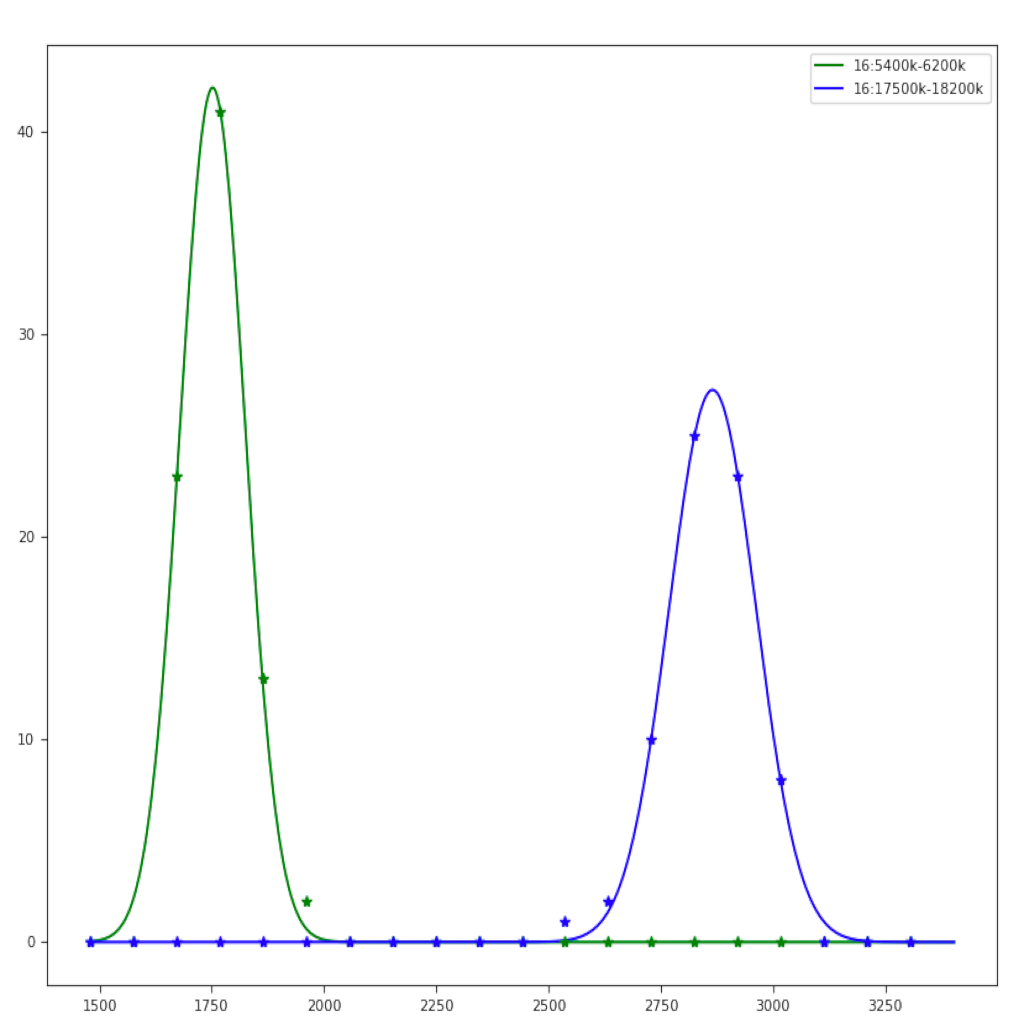
| Region plot ([see example](examples/region.md))| Compare regions ([see example](examples/compare.md))|
|
|
| Region plot ([see example](examples/region.md))| Compare regions ([see example](examples/compare.md))|
| |
| |
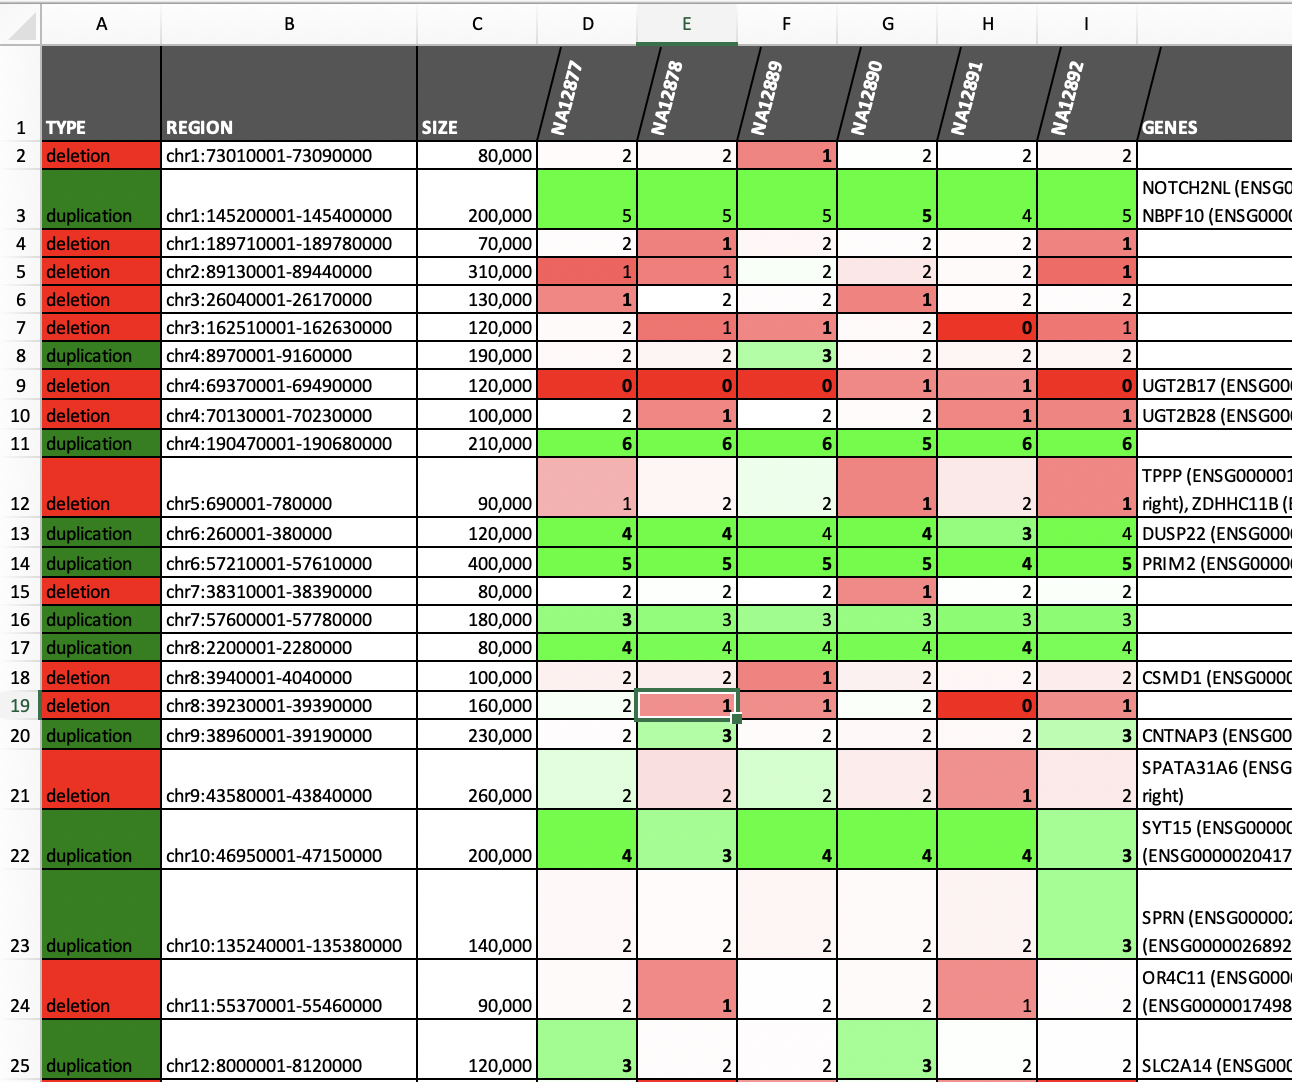
| Merging and annotating calls ([see example](examples/merging.md))|Call somatic CNAs ([see example](examples/JointCaller.md))|
|
|
| Merging and annotating calls ([see example](examples/merging.md))|Call somatic CNAs ([see example](examples/JointCaller.md))|
| |
| ## Install
### Dependencies
* requests>=2.0
* gnureadline
* pathlib>=1.0
* pysam>=0.15
* numpy>=1.16
* scipy>=1.1
* matplotlib>=2.2
* h5py>=2.9
* xlsxwriter>=1.3
* pathlib>=1.0
Optional:
* pyBigWig - for JBrowse export functionality
* ROOT - for CNVnator root import/export functionality
* seaborn - for additional plotting styles
### Install by cloning from GitHub
```
> git clone https://github.com/abyzovlab/CNVpytor.git
> cd CNVpytor
> pip install .
```
For single user (without admin privileges) use:
```
> pip install --user .
```
### Install using pip
Old version (v1.0) is available using pip directly (not recomended):
```
> pip install cnvpytor
> cnvpytor -download
```
## Use as a command line tool

_Diagram made using [Draw.io](https://github.com/jgraph/drawio)._
### Call CNVs using read depth:
```
> cnvpytor -root file.pytor -rd file.bam
> cnvpytor -root file.pytor -his 1000 10000 100000
> cnvpytor -root file.pytor -partition 1000 10000 100000
> cnvpytor -root file.pytor -call 1000 10000 100000
```
### Importing and using single nucleotide polymorphism data:
```
> cnvpytor -root file.pytor -snp file.vcf -sample sample_name
> cnvpytor -root file.pytor -pileup file.bam # OPTIONAL
> cnvpytor -root file.pytor -mask_snps # OPTIONAL
> cnvpytor -root file.pytor -baf 10000 100000
```
### Filtering calls form view mode
```
> cnvpytor -root file.pytor -view 100000
print calls
set Q0_range 0 0.5
set size_range 100000 inf
print calls
set p_range 0 0.00001
set print_filename output.xls
print calls
set print_filename output.vcf
print calls
```
Annotating filtered calls:
```
> cnvpytor -root file.pytor -view 100000
set Q0_range 0 0.5
set size_range 100000 inf
set print_filename output.tsv
set annotate
print calls
```
### Merging calls form multiple samples
```
> cnvpytor -root file1.pytor file2.pytor ... -view 100000
print merged_calls
set Q0_range 0 0.5
set size_range 100000 inf
set print_filename output.xls
print merged_calls
```
Plotting all merged calls:
```
> cnvpytor -root file1.pytor file2.pytor ... -view 100000
set Q0_range 0 0.5
set size_range 100000 inf
set print_filename output.xls
set print
set output_filename prefix.png
print merged_calls
```
Annotating merged calls:
```
> cnvpytor -root file1.pytor file2.pytor ... -view 100000
set Q0_range 0 0.5
set size_range 100000 inf
set print_filename output.xls
set annotate
print merged_calls
```
### Genotyping from command line
```
> cnvpytor -root file.pytor -genotype 10000 100000
12:11396601-11436500
12:11396601-11436500 1.933261 1.937531
22:20999401-21300400
22:20999401-21300400 1.949186 1.957068
```
Genotyping with additional informations:
```
> cnvpytor -root file.pytor -genotype 10000 100000 -a
12:11396601-11436500
12:11396601-11436500 2.0152 1.629621e+04 9.670589e+08 0.0000 0.0000 4156900 1.0000 50 4 0.0000 1.000000e+00
```
Genotyping using P filtered (1000 Genome Project strict mask) RD signal:
```
> cnvpytor -root file.pytor -genotype 10000 100000 -a -rd_use_mask
1:800k-900k
1:800000-900000 2.3012 1.032124e+01 8.296037e+06 0.0021 0.0000 278700 0.8000 48 28 0.0000 1.000000e+00
```
### Plot from interactive mode
CNVpytor view interactive mode is implemented with ** completion** and internal documentation (**help** command).
To enter interactive mode use '-view bin_size' option:
```
> cnvpytor -root file.pytor -view 10000
cnvpytor> chr1:1M-50M
cnvpytor> rd
cnvpytor> set panels rd likelihood
cnvpytor> show
Parameters
* baf_colors: ['gray', 'black', 'red', 'green', 'blue']
* bin_size: 100000
* chrom: []
* contrast: 20
* dpi: 200
* file_titles: []
* grid: auto
* lh_colors: ['yellow']
* markersize: auto
* min_segment_size: 0
* output_filename:
* panels: ['rd']
* plot_file: 0
* plot_files: [0]
0: file.pytor
* rd_call: True
* rd_call_mosaic: False
* rd_circular_colors: ['#555555', '#aaaaaa']
* rd_colors: ['grey', 'black', 'red', 'green', 'blue']
* rd_manhattan_call: False
* rd_manhattan_range: [0, 2]
* rd_partition: True
* rd_range: [0, 3]
* rd_raw: True
* rd_use_gc_corr: True
* rd_use_mask: False
* snp_call: False
* snp_circular_colors: ['#00ff00', '#0000ff']
* snp_colors: ['yellow', 'orange', 'cyan', 'blue', 'lime', 'green', 'yellow', 'orange']
* snp_use_id: False
* snp_use_mask: True
* snp_use_phase: False
* style: None
* xkcd: False
cnvpytor> help markersize
markersize
Size of markers used in scatter like plots (e.g. manhattan, snp).
TYPE
float or str
DEFAULT
auto
PLOTS AFFECTS
manhattan, snp, region plot with snp panel
EXAMPLE(s)
set markersize 10
set markersize auto
SEE ALSO
rd_colors, snp_colors, baf_colors, lh_colors
cnvpytor> set bin_size 100000
cnvpytor> chr1:1M-50M chr2:60M-65M > filename.png
```
### Plot from script
```
> echo "rdstat" | cnvpytor -root file.pytor -view 100000 -o prefix.png
> cnvpytor -root file.pytor -view 100000 < cnvpytor -root file.pytor -view 100000 < script.spytor
```
### Persistent history and viewer configuration (experimental)
CNVpytor will automatically store command line history into file `~/.cnvpytor/history` if there is directory
`~/.cnvpytor`. To enable this functionality create this directory:
```
> mkdir ~/.cnvpytor
```
To configure viewer parameters create file ```viewer.conf``` within same directory in following format:
```
{
'panels': ['rd', 'likelihood'],
'snp_colors': ['orange', 'brown', 'green', 'blue', 'green', 'blue', 'orange', 'brown']
}
```
This way you can set any parameter using python syntax. Any parameter specified here will overwrite
parameters provided in command line.
## Use as a Python package
CNVpytor is not just command line tool but also Python package.
For more details check [API Documentation](https://abyzovlab.github.io/CNVpytor/) or
see examples in [Jupyter notebook](examples/CNVpytor.ipynb).
## JBrowse plugin for CNVpytor
A JBrowse plugin is developed that does on-fly analysis of read depth from VCF file.
https://github.com/abyzovlab/CNVpytorVCF
## Export
### 1. CNVpytor data visualization using JBrowse
#### JBrowse version and plugins
JBrowse version: https://github.com/GMOD/jbrowse/archive/1.16.6-release.tar.gz
Plugins:
- multibigwig (https://github.com/elsiklab/multibigwig )
- multiscalebigwig (https://github.com/cmdcolin/multiscalebigwig)
**Note:** The JBrowse development version is required as integration of different jbrowse plugins are needed.
#### Usage
To generate cnvpytor file for JBrowse visualization:
```
cnvpytor -root [pytor files] -export jbrowse [optional argument: output path]
Default export directory name:
- For single pytor file input: jbrowse_[pytor file name]
- For multiple pytor file input: cnvpytor_jbrowse_export
```
The above command creates all the necessary files that are required to visualize the cnvpytor data.
To view cnvpytor file using JBrowse, users need to install JBrowse and required plugins (See JBrowse version and plugins section).
`
http://localhost/jbrowse/?data=[export directory]
`
```
# Example usage
cnvpytor -root test.pytor -export jbrowse
http://localhost/jbrowse/?data=jbrowse_test
```
[See More](GettingStarted.md#visualize-cnvpytor-data-inside-jbrowse)
## Bugs
Please report any bugs that you find on GitHub:
https://github.com/abyzovlab/CNVpytor/issues
Or, even better, fork the repository on GitHub and create a pull request.
## License
Released under MIT licence.
## Install
### Dependencies
* requests>=2.0
* gnureadline
* pathlib>=1.0
* pysam>=0.15
* numpy>=1.16
* scipy>=1.1
* matplotlib>=2.2
* h5py>=2.9
* xlsxwriter>=1.3
* pathlib>=1.0
Optional:
* pyBigWig - for JBrowse export functionality
* ROOT - for CNVnator root import/export functionality
* seaborn - for additional plotting styles
### Install by cloning from GitHub
```
> git clone https://github.com/abyzovlab/CNVpytor.git
> cd CNVpytor
> pip install .
```
For single user (without admin privileges) use:
```
> pip install --user .
```
### Install using pip
Old version (v1.0) is available using pip directly (not recomended):
```
> pip install cnvpytor
> cnvpytor -download
```
## Use as a command line tool

_Diagram made using [Draw.io](https://github.com/jgraph/drawio)._
### Call CNVs using read depth:
```
> cnvpytor -root file.pytor -rd file.bam
> cnvpytor -root file.pytor -his 1000 10000 100000
> cnvpytor -root file.pytor -partition 1000 10000 100000
> cnvpytor -root file.pytor -call 1000 10000 100000
```
### Importing and using single nucleotide polymorphism data:
```
> cnvpytor -root file.pytor -snp file.vcf -sample sample_name
> cnvpytor -root file.pytor -pileup file.bam # OPTIONAL
> cnvpytor -root file.pytor -mask_snps # OPTIONAL
> cnvpytor -root file.pytor -baf 10000 100000
```
### Filtering calls form view mode
```
> cnvpytor -root file.pytor -view 100000
print calls
set Q0_range 0 0.5
set size_range 100000 inf
print calls
set p_range 0 0.00001
set print_filename output.xls
print calls
set print_filename output.vcf
print calls
```
Annotating filtered calls:
```
> cnvpytor -root file.pytor -view 100000
set Q0_range 0 0.5
set size_range 100000 inf
set print_filename output.tsv
set annotate
print calls
```
### Merging calls form multiple samples
```
> cnvpytor -root file1.pytor file2.pytor ... -view 100000
print merged_calls
set Q0_range 0 0.5
set size_range 100000 inf
set print_filename output.xls
print merged_calls
```
Plotting all merged calls:
```
> cnvpytor -root file1.pytor file2.pytor ... -view 100000
set Q0_range 0 0.5
set size_range 100000 inf
set print_filename output.xls
set print
set output_filename prefix.png
print merged_calls
```
Annotating merged calls:
```
> cnvpytor -root file1.pytor file2.pytor ... -view 100000
set Q0_range 0 0.5
set size_range 100000 inf
set print_filename output.xls
set annotate
print merged_calls
```
### Genotyping from command line
```
> cnvpytor -root file.pytor -genotype 10000 100000
12:11396601-11436500
12:11396601-11436500 1.933261 1.937531
22:20999401-21300400
22:20999401-21300400 1.949186 1.957068
```
Genotyping with additional informations:
```
> cnvpytor -root file.pytor -genotype 10000 100000 -a
12:11396601-11436500
12:11396601-11436500 2.0152 1.629621e+04 9.670589e+08 0.0000 0.0000 4156900 1.0000 50 4 0.0000 1.000000e+00
```
Genotyping using P filtered (1000 Genome Project strict mask) RD signal:
```
> cnvpytor -root file.pytor -genotype 10000 100000 -a -rd_use_mask
1:800k-900k
1:800000-900000 2.3012 1.032124e+01 8.296037e+06 0.0021 0.0000 278700 0.8000 48 28 0.0000 1.000000e+00
```
### Plot from interactive mode
CNVpytor view interactive mode is implemented with ** completion** and internal documentation (**help** command).
To enter interactive mode use '-view bin_size' option:
```
> cnvpytor -root file.pytor -view 10000
cnvpytor> chr1:1M-50M
cnvpytor> rd
cnvpytor> set panels rd likelihood
cnvpytor> show
Parameters
* baf_colors: ['gray', 'black', 'red', 'green', 'blue']
* bin_size: 100000
* chrom: []
* contrast: 20
* dpi: 200
* file_titles: []
* grid: auto
* lh_colors: ['yellow']
* markersize: auto
* min_segment_size: 0
* output_filename:
* panels: ['rd']
* plot_file: 0
* plot_files: [0]
0: file.pytor
* rd_call: True
* rd_call_mosaic: False
* rd_circular_colors: ['#555555', '#aaaaaa']
* rd_colors: ['grey', 'black', 'red', 'green', 'blue']
* rd_manhattan_call: False
* rd_manhattan_range: [0, 2]
* rd_partition: True
* rd_range: [0, 3]
* rd_raw: True
* rd_use_gc_corr: True
* rd_use_mask: False
* snp_call: False
* snp_circular_colors: ['#00ff00', '#0000ff']
* snp_colors: ['yellow', 'orange', 'cyan', 'blue', 'lime', 'green', 'yellow', 'orange']
* snp_use_id: False
* snp_use_mask: True
* snp_use_phase: False
* style: None
* xkcd: False
cnvpytor> help markersize
markersize
Size of markers used in scatter like plots (e.g. manhattan, snp).
TYPE
float or str
DEFAULT
auto
PLOTS AFFECTS
manhattan, snp, region plot with snp panel
EXAMPLE(s)
set markersize 10
set markersize auto
SEE ALSO
rd_colors, snp_colors, baf_colors, lh_colors
cnvpytor> set bin_size 100000
cnvpytor> chr1:1M-50M chr2:60M-65M > filename.png
```
### Plot from script
```
> echo "rdstat" | cnvpytor -root file.pytor -view 100000 -o prefix.png
> cnvpytor -root file.pytor -view 100000 < cnvpytor -root file.pytor -view 100000 < script.spytor
```
### Persistent history and viewer configuration (experimental)
CNVpytor will automatically store command line history into file `~/.cnvpytor/history` if there is directory
`~/.cnvpytor`. To enable this functionality create this directory:
```
> mkdir ~/.cnvpytor
```
To configure viewer parameters create file ```viewer.conf``` within same directory in following format:
```
{
'panels': ['rd', 'likelihood'],
'snp_colors': ['orange', 'brown', 'green', 'blue', 'green', 'blue', 'orange', 'brown']
}
```
This way you can set any parameter using python syntax. Any parameter specified here will overwrite
parameters provided in command line.
## Use as a Python package
CNVpytor is not just command line tool but also Python package.
For more details check [API Documentation](https://abyzovlab.github.io/CNVpytor/) or
see examples in [Jupyter notebook](examples/CNVpytor.ipynb).
## JBrowse plugin for CNVpytor
A JBrowse plugin is developed that does on-fly analysis of read depth from VCF file.
https://github.com/abyzovlab/CNVpytorVCF
## Export
### 1. CNVpytor data visualization using JBrowse
#### JBrowse version and plugins
JBrowse version: https://github.com/GMOD/jbrowse/archive/1.16.6-release.tar.gz
Plugins:
- multibigwig (https://github.com/elsiklab/multibigwig )
- multiscalebigwig (https://github.com/cmdcolin/multiscalebigwig)
**Note:** The JBrowse development version is required as integration of different jbrowse plugins are needed.
#### Usage
To generate cnvpytor file for JBrowse visualization:
```
cnvpytor -root [pytor files] -export jbrowse [optional argument: output path]
Default export directory name:
- For single pytor file input: jbrowse_[pytor file name]
- For multiple pytor file input: cnvpytor_jbrowse_export
```
The above command creates all the necessary files that are required to visualize the cnvpytor data.
To view cnvpytor file using JBrowse, users need to install JBrowse and required plugins (See JBrowse version and plugins section).
`
http://localhost/jbrowse/?data=[export directory]
`
```
# Example usage
cnvpytor -root test.pytor -export jbrowse
http://localhost/jbrowse/?data=jbrowse_test
```
[See More](GettingStarted.md#visualize-cnvpytor-data-inside-jbrowse)
## Bugs
Please report any bugs that you find on GitHub:
https://github.com/abyzovlab/CNVpytor/issues
Or, even better, fork the repository on GitHub and create a pull request.
## License
Released under MIT licence.