# vue-tree-chart
**Repository Path**: shengtaii/vue-tree-chart
## Basic Information
- **Project Name**: vue-tree-chart
- **Description**: No description available
- **Primary Language**: Unknown
- **License**: Not specified
- **Default Branch**: master
- **Homepage**: None
- **GVP Project**: No
## Statistics
- **Stars**: 1
- **Forks**: 0
- **Created**: 2021-01-27
- **Last Updated**: 2021-12-03
## Categories & Tags
**Categories**: Uncategorized
**Tags**: None
## README
## [English](./README.md) | [中文](./README-CN.md)
## Demo 页面
https://ssthouse.github.io/vue-tree-chart/#/svgTree
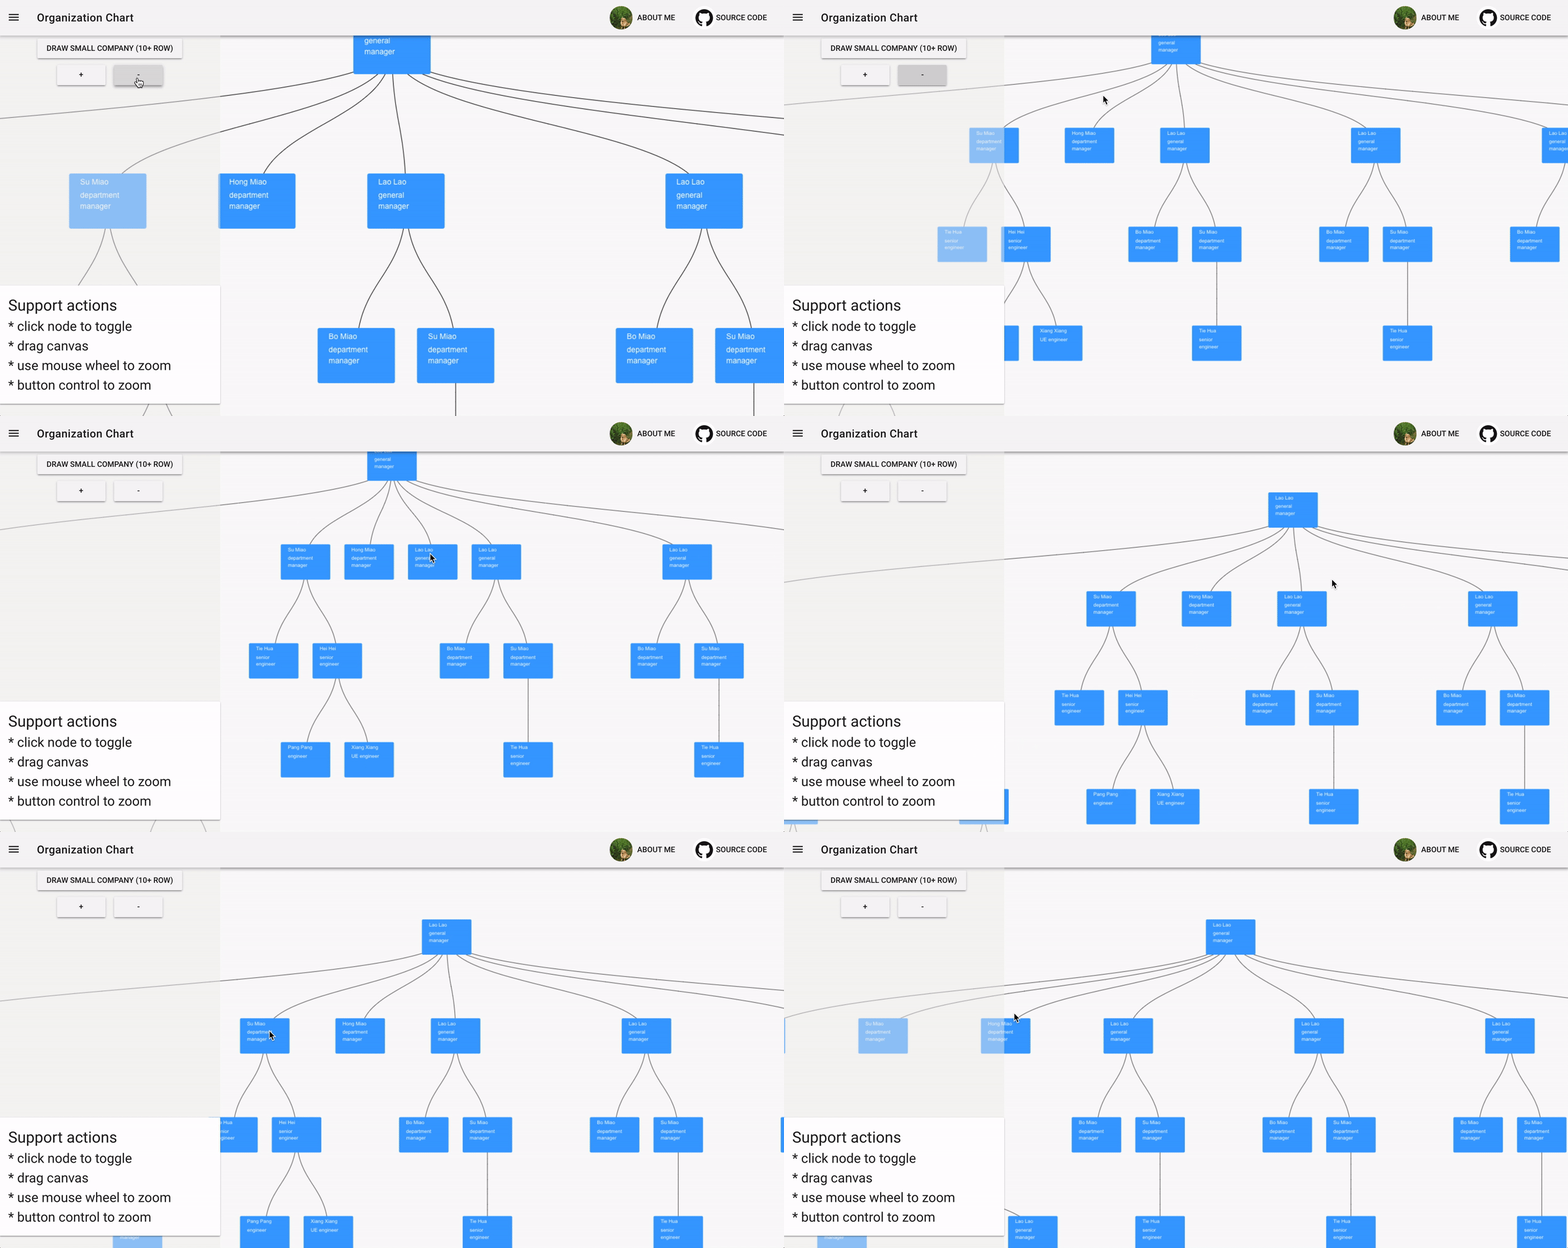
## Demo 动图

## 使用到的技术点
### Svg 版本
- 使用 D3.js 计算**节点**和**链接线**的坐标
- 使用 Vue 控制 DOM 节点的变更
- 使用 Vue slot 抽象节点渲染流程, 让使用者可以高度定制化节点绘制
### Canvas 版本
- 将 D3.js 和 Canvas 一起使用,提升绘制效率(其中 D3.js 使用虚拟 DOM 就行渲染,Canvas 取虚拟 DOM 节点坐标进行绘制)
- 使用 `唯一颜色值`的方案,实现 Canvas 上点击事件的监听 (你也可以参考这篇文档了解其详细实现: https://medium.com/@lverspohl/how-to-turn-d3-and-canvas-into-good-friends-b7a240a32915)
## 如何将图中数据替换为我的数据?
### Svg version
Svg 版本通过 Vue 进行了良好的封装,使用起来非常方便且灵活.
#### 1.安装
执行下面的命令安装 Svg 版本的 tree-chart
`npm install @ssthouse/vue-tree-chart`
#### 2. 注册 `vue-tree` 组件
```javascript
import VueTree from "@ssthouse/vue-tree-chart";
import Vue from "vue";
Vue.component("vue-tree", VueTree);
```
#### 3. 使用组件
**3.1 基本用法**
See Code
```vue
```

**3.2 使用 vue-slot 异化展示折叠节点**
See Code
```vue
{{ node.value }}
```

**3.3 自定义渲染富媒体节点**
See Code
```vue
```

#### 4. API
**4.1 props 参数**
| | type | default | description |
| --------- | ------ | ------------------------------------------------------------------------- | ------------------------------------------------------------------------------------ |
| dataset | Object | null | nested tree data |
| config | Object | {
nodeWidth: 100,
nodeHeight: 100,
levelHeight: 200
} | nodeWidth 和 nodeHeight 用于配置树状图节点大小. levelHeight 用于配置树状图一层的高度 |
| linkStyle | String | 'curve' | 控制连接线样式, 可选项: 'curve' 或 'straight' |
| direction | string | 'vertical' | 控制树状图方向, 可选项: 'vertical' 或 'horizontal' |
**4.2 slot 参数**
该组件仅支持 **默认 slot**.
基本用法如下所示:
```vue
{{ node.value }}
```
slot 提供两个参数用于渲染树状图节点内容。
| slot param | type | description |
| ---------- | ------- | -------------------------------- |
| node | Object | current node data to be rendered |
| collapsed | Boolean | current node collapse status |
### Canavs 版本
canvas 的版本, 因为其绘制过程较难抽象, 且仅仅在数据量较大的情况下才有意义,所以没有发布为 npm module.
如果你希望使用 canvas 版本的 tree-chart,可以将源代码下载下来,并进行一下步骤替换为自己的数据集:
- 将 `/src/base/data-generator.js`文件中的数据替换为你自己的数据.
- 在 `/src/components/org-chart.js`文件中,修改`drawShowCanvas`函数的绘制逻辑.
## 开始开发
```bash
# install dependencies
npm install
# serve with hot reload at localhost
npm run dev
# build for production with minification (build to ./docs folder, which can be auto servered by github page 🤓)
npm run build
```