# CBNplot
**Repository Path**: swcyo/CBNplot
## Basic Information
- **Project Name**: CBNplot
- **Description**: https://github.com/noriakis/CBNplot
- **Primary Language**: Unknown
- **License**: Not specified
- **Default Branch**: main
- **Homepage**: None
- **GVP Project**: No
## Statistics
- **Stars**: 0
- **Forks**: 0
- **Created**: 2022-10-01
- **Last Updated**: 2022-10-01
## Categories & Tags
**Categories**: Uncategorized
**Tags**: None
## README
## CBNplot: Bayesian network plot for the enrichment analysis results
[](https://github.com/noriakis/CBNplot/actions/workflows/R-CMD-check.yaml)
Plot bayesian network inferred from expression data based on the enrichment analysis results from libraries including `clusterProfiler` and `ReactomePA` using `bnlearn`.
### Installation
```R
library(devtools)
install_github("noriakis/CBNplot")
```
### Usage
- Documentation: [https://noriakis.github.io/software/CBNplot/](https://noriakis.github.io/software/CBNplot/)
- Web server: [https://cbnplot.com](https://cbnplot.com)
### Plot examples
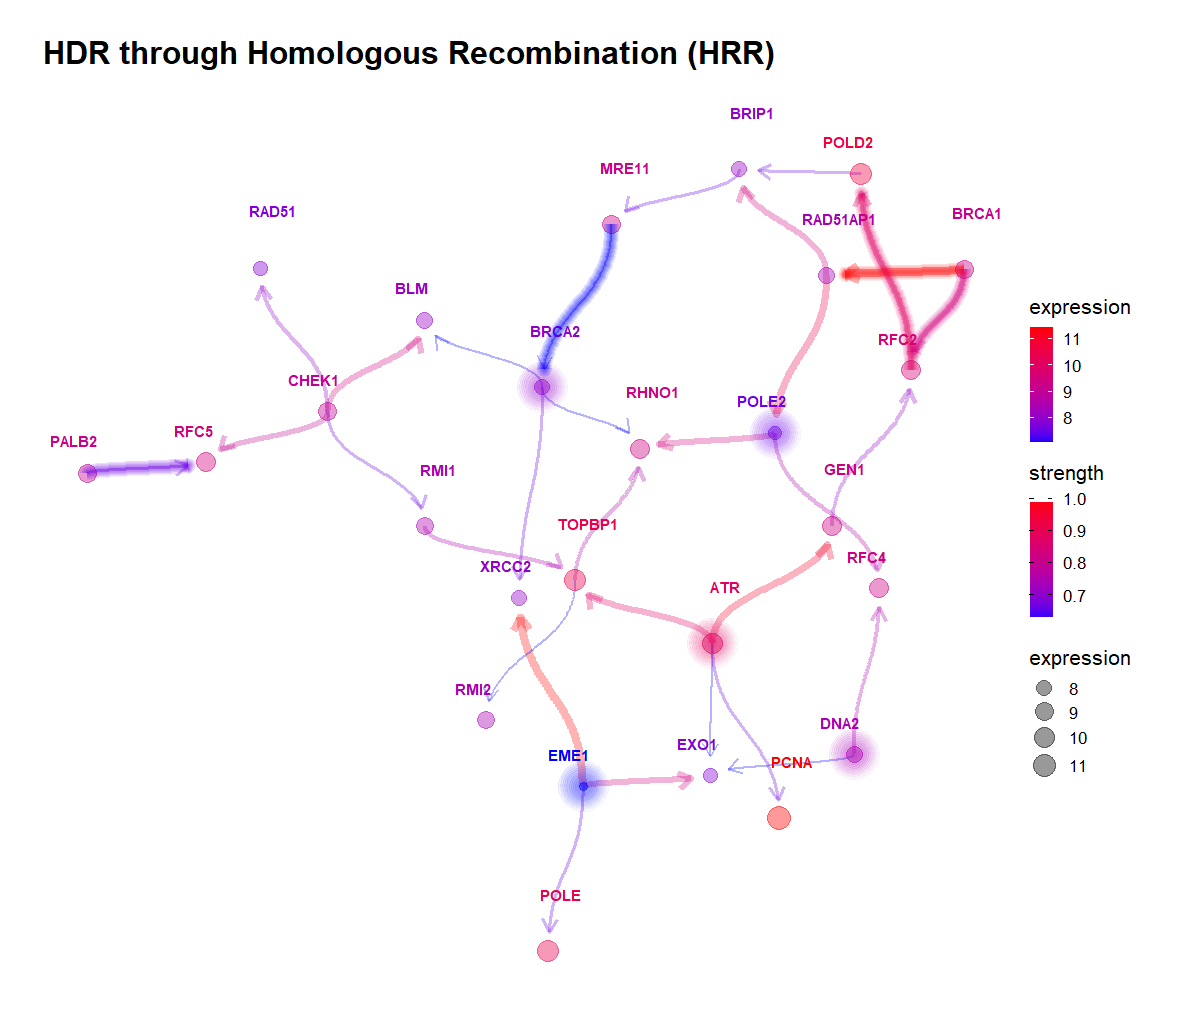
- The gene-to-gene relationship compared with the reference network.
 - The plot is customizable highliting edges and nodes like hub genes.
 - The example using `MicrobiomeProfiler`, thanks to the fix by [@xiangpin](https://github.com/xiangpin/).
``` R
library(MicrobiomeProfiler)]
data(Rat_data)
ko.res <- enrichKO(Rat_data)
exp.dat <- matrix(abs(rnorm(910)), 91, 10) %>% magrittr::set_rownames(value=Rat_data) %>% magrittr::set_colnames(value=paste0('S', seq_len(ncol(.))))
exp.dat %>% head
library(CBNplot)
bngeneplot(ko.res, exp=exp.dat, pathNum=1, orgDb=NULL)
```
- The example using `MicrobiomeProfiler`, thanks to the fix by [@xiangpin](https://github.com/xiangpin/).
``` R
library(MicrobiomeProfiler)]
data(Rat_data)
ko.res <- enrichKO(Rat_data)
exp.dat <- matrix(abs(rnorm(910)), 91, 10) %>% magrittr::set_rownames(value=Rat_data) %>% magrittr::set_colnames(value=paste0('S', seq_len(ncol(.))))
exp.dat %>% head
library(CBNplot)
bngeneplot(ko.res, exp=exp.dat, pathNum=1, orgDb=NULL)
```
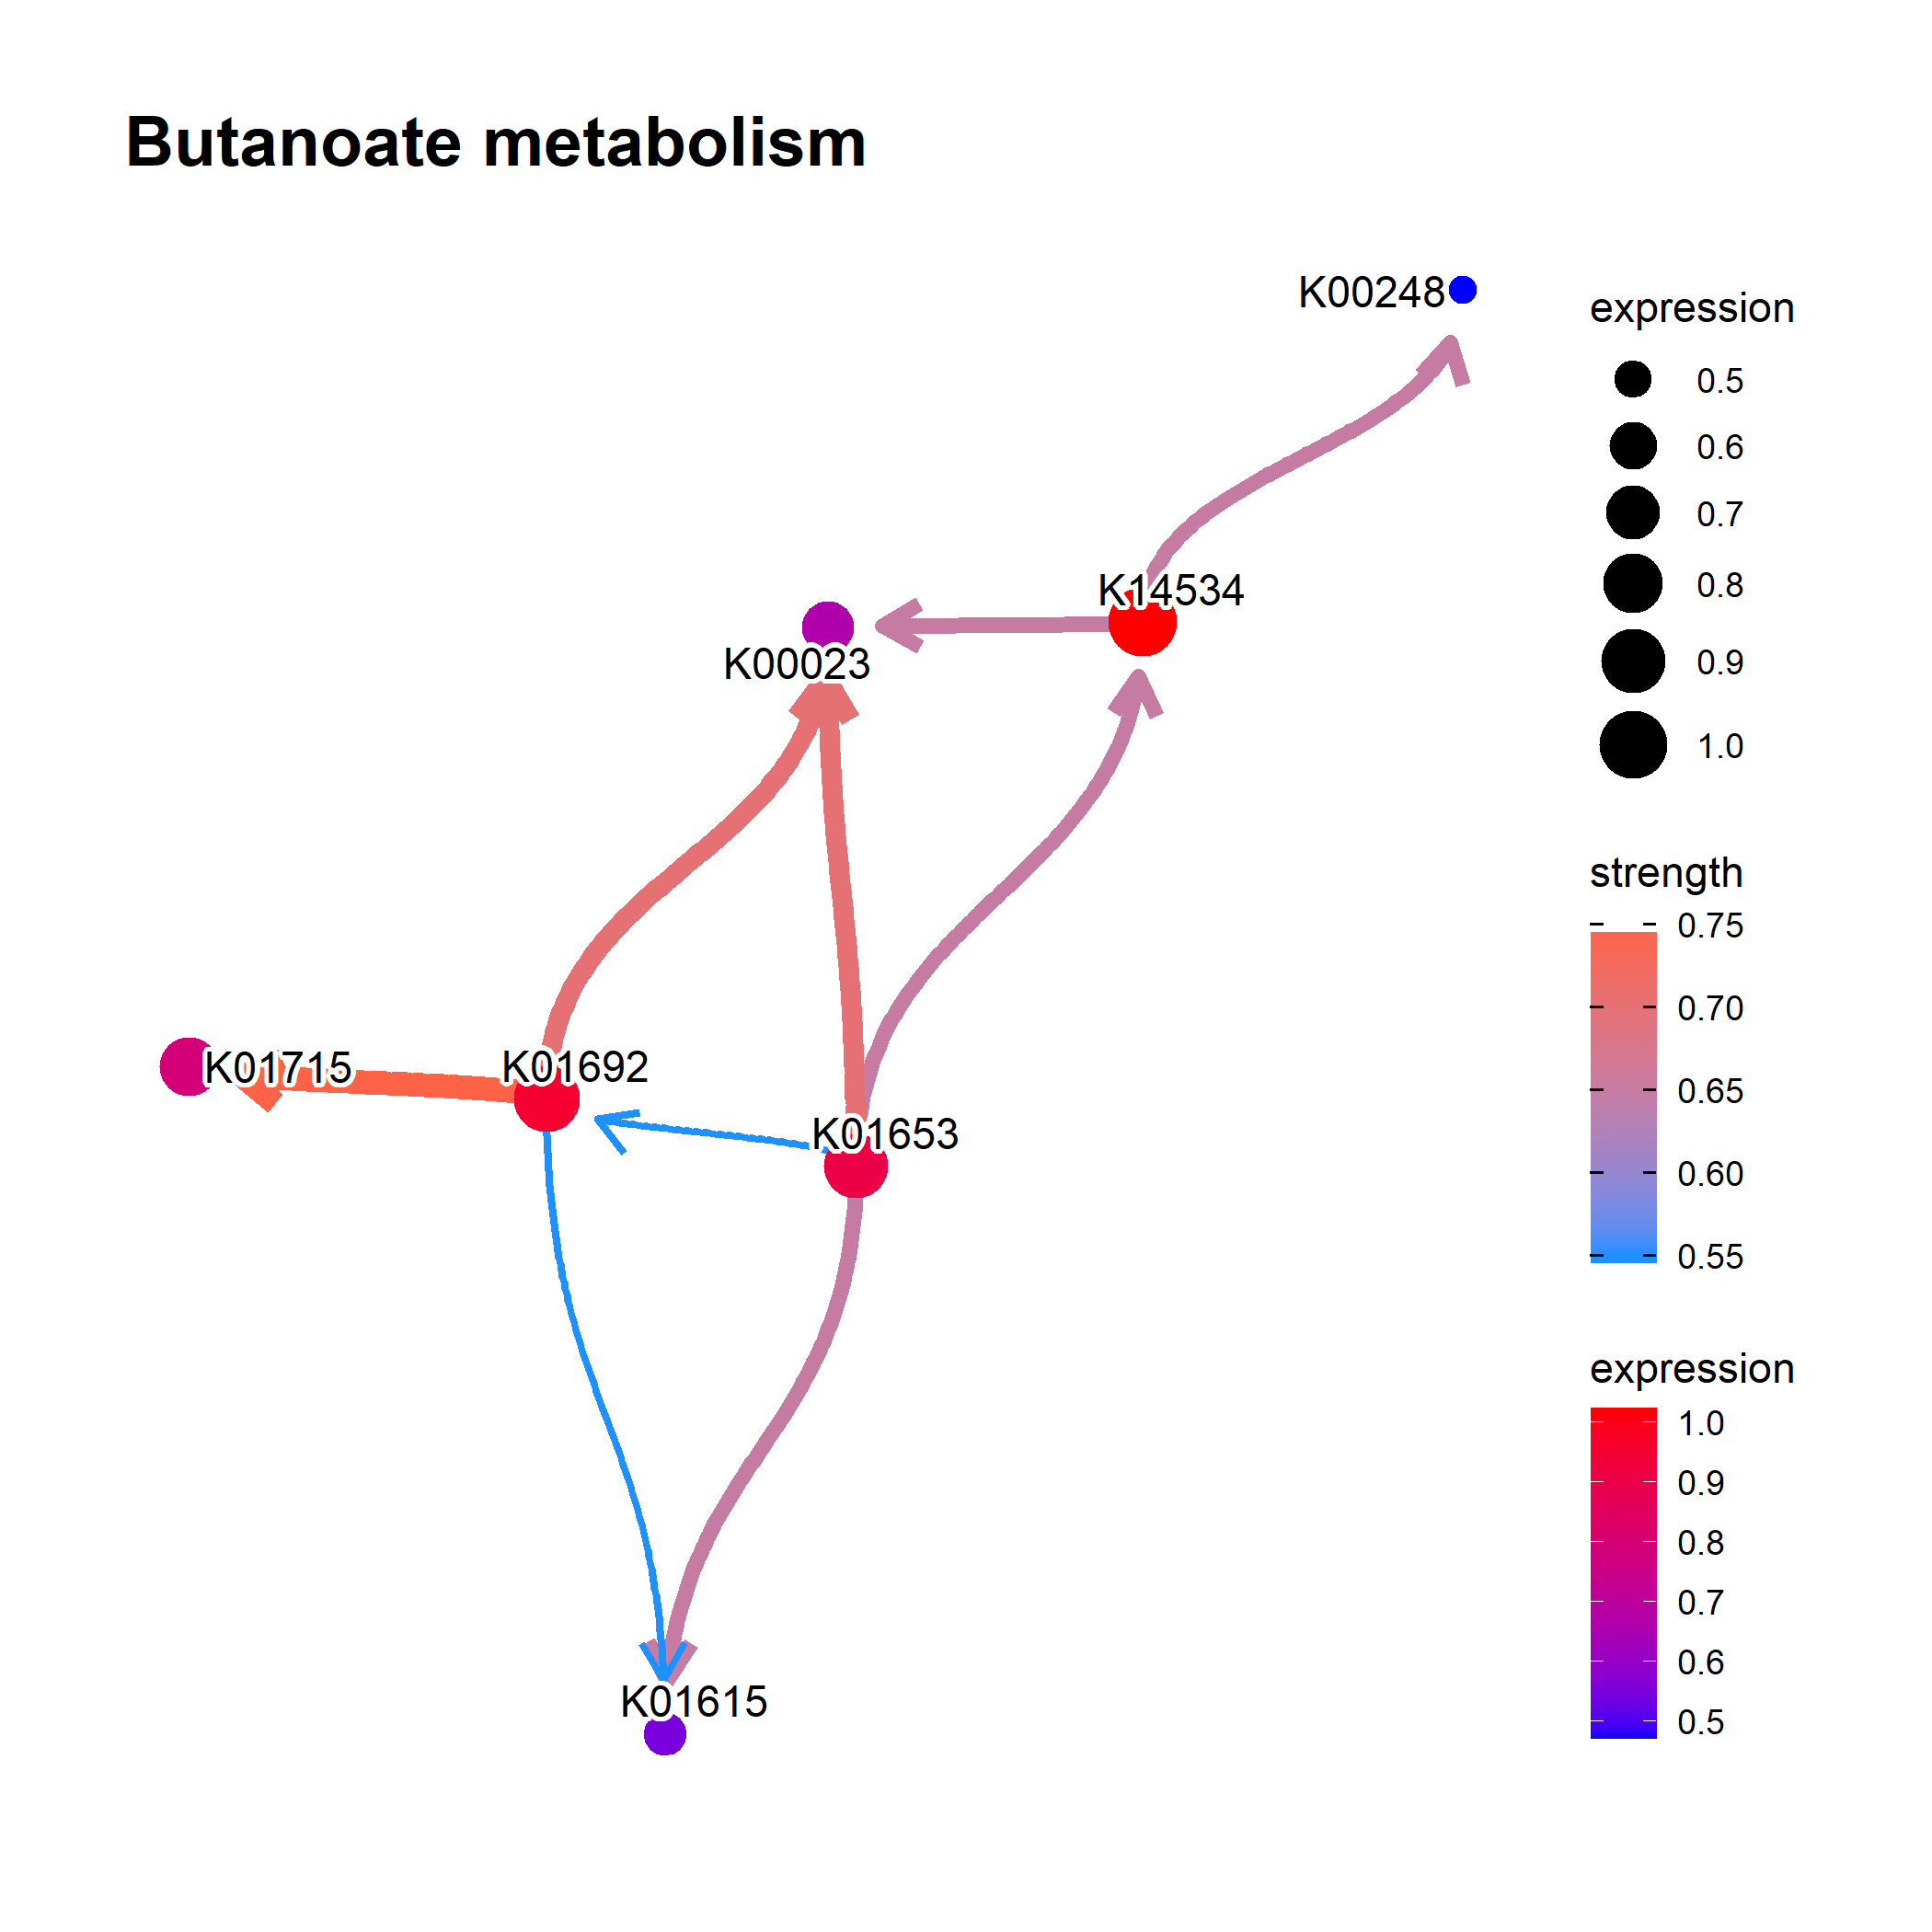 - Another customized plot.
