# hvsrpy
**Repository Path**: ucaslilong/hvsrpy
## Basic Information
- **Project Name**: hvsrpy
- **Description**: A Python package for Horizontal-to-Vertical (H/V, HVSR) Spectral Ratio Processing.
- **Primary Language**: Unknown
- **License**: GPL-3.0
- **Default Branch**: dev
- **Homepage**: None
- **GVP Project**: No
## Statistics
- **Stars**: 0
- **Forks**: 0
- **Created**: 2022-02-11
- **Last Updated**: 2024-05-30
## Categories & Tags
**Categories**: Uncategorized
**Tags**: None
## README
# _hvsrpy_ - A Python package for horizontal-to-vertical spectral ratio processing
> Joseph P. Vantassel, The University of Texas at Austin
[](https://zenodo.org/badge/latestdoi/219310971)
[](https://github.com/jpvantassel/hvsrpy/blob/main/LICENSE.txt)
[](https://circleci.com/gh/jpvantassel/hvsrpy)
[](https://hvsrpy.readthedocs.io/en/latest/?badge=latest)
[](https://lgtm.com/projects/g/jpvantassel/hvsrpy/context:python)
[](https://www.codacy.com/gh/jpvantassel/hvsrpy/dashboard?utm_source=github.com&utm_medium=referral&utm_content=jpvantassel/hvsrpy&utm_campaign=Badge_Grade)
[](https://codecov.io/gh/jpvantassel/hvsrpy)

## Table of Contents
---
- [About _hvsrpy_](#About-hvsrpy)
- [Why use _hvsrpy_](#Why-use-hvsrpy)
- [A Comparison of _hvsrpy_ with _Geopsy_](#A-comparison-of-hvsrpy-with-Geopsy)
- [Getting Started](#Getting-Started)
- [Additional Comparisons between _hvsrpy_ and _Geopsy_](#Additional-Comparisons-between-hvsrpy-and-Geopsy)
- [Multiple Windows](#Multiple-Windows)
- [Single Window](#Single-Window)
## About _hvsrpy_
---
`hvsrpy` is a Python package for performing horizontal-to-vertical spectral
ratio (HVSR) processing. `hvsrpy` was developed by Joseph P. Vantassel with
contributions from Dana M. Brannon under the supervision of Professor Brady R.
Cox at The University of Texas at Austin. The automated frequency-domain
window-rejection algorithm and lognormal statistics implemented in `hvsrpy`
are detailed in Cox et al. (2020). The statistical approach to incorporate
azimuth variability implemented in `hvsrpy` is detailed in Cheng et al. (2020).
The approach to define statistics from spatially distributed HVSR measurements
implemented in `hvsrpy` is detailed in Cheng et al. (2021).
If you use `hvsrpy` in your research or consulting, we ask you please cite the
following:
> Joseph Vantassel. (2020). jpvantassel/hvsrpy: latest (Concept). Zenodo.
> [http://doi.org/10.5281/zenodo.3666956](http://doi.org/10.5281/zenodo.3666956)
_Note: For software, version specific citations should be preferred to
general concept citations, such as that listed above. To generate a version
specific citation for `hvsrpy`, please use the citation tool on the `hvsrpy`
[archive](http://doi.org/10.5281/zenodo.3666956)._
These works provide background for the calculations performed by `hvsrpy`.
> Cox, B. R., Cheng, T., Vantassel, J. P., & Manuel, L. (2020). "A statistical
> representation and frequency-domain window-rejection algorithm for single-station
> HVSR measurements. Geophysical Journal International, 221(3), 2170–2183.
> https://doi.org/10.1093/gji/ggaa119
> Cheng, T., Cox, B. R., Vantassel, J. P., and Manuel, L. (2020). "A
> statistical approach to account for azimuthal variability in single-station
> HVSR measurements." Geophysical Journal International, 223(2), 1040–1053.
> https://doi.org/10.1093/gji/ggaa342
> Cheng, T., Hallal, M. M., Vantassel, J. P., and Cox, B. R., (2021).
> "Estimating Unbiased Statistics for Fundamental Site Frequency Using
> Spatially Distributed HVSR Measurements and Voronoi Tessellation.
> J. Geotech. Geoenviron. Eng. 147, 04021068.
> https://doi.org/10.1061/(ASCE)GT.1943-5606.0002551
> SESAME. (2004). Guidelines for the Implementation of the H/V Spectral Ratio
> Technique on Ambient Vibrations Measurements, Processing, and Interpretation.
> European Commission - Research General Directorate, 62, European Commission -
> Research General Directorate.
`hvsrpy` would not exist without the help of many others. As a small display of
gratitude, we thank them individually
[here](https://github.com/jpvantassel/hvsrpy/blob/main/thanks.md).
## Why use _hvsrpy_
---
`hvsrpy` contains features not currently available in any other commercial or
open-source software, including:
- A lognormal distribution for the fundamental site frequency (`f0`) so the
uncertainty in `f0` can be represented consistently in frequency or period.
- Ability to use the geometric-mean, squared-average, or any azimuth of your
choice.
- Easy access to the HVSR data from each time window (and azimuth in the case
of azimuthal calculations), not only the mean/median curve.
- A method to calculate statistics on `f0` that incorporates azimuthal
variability.
- A method for developing rigorous and unbiased spatial statistics.
- A fully-automated frequency-domain window-rejection algorithm.
- Automatic checking of the SESAME (2004) peak reliability and clarity
criteria.
- A command line interface for highly performant batch-style processing.
### Example output from `hvsrpy` when considering the geometric-mean of the horizontal components
 | | Lognormal Median | Lognormal Standard Deviation |
|-----------------------------------|------------------|------------------------------|
| Fundamental Site Frequency, f0,GM | 0.72 | 0.11 |
| Fundamental Site Period, T0,GM | 1.40 | 0.11 |
### Example output from `hvsrpy` when considering azimuthal variability
| | Lognormal Median | Lognormal Standard Deviation |
|-----------------------------------|------------------|------------------------------|
| Fundamental Site Frequency, f0,GM | 0.72 | 0.11 |
| Fundamental Site Period, T0,GM | 1.40 | 0.11 |
### Example output from `hvsrpy` when considering azimuthal variability
 | | Lognormal Median | Lognormal Standard Deviation |
|-----------------------------------|------------------|------------------------------|
| Fundamental Site Frequency, f0,AZ | 0.68 | 0.18 |
| Fundamental Site Period, T0,AZ | 1.48 | 0.18 |
### Example output from `hvsrpy` when considering spatial variability
| | Lognormal Median | Lognormal Standard Deviation |
|-----------------------------------|------------------|------------------------------|
| Fundamental Site Frequency, f0,AZ | 0.68 | 0.18 |
| Fundamental Site Period, T0,AZ | 1.48 | 0.18 |
### Example output from `hvsrpy` when considering spatial variability
 | | Lognormal Median | Lognormal Standard Deviation |
|-----------------------------------|------------------|------------------------------|
| Fundamental Site Frequency, f0,XY | 0.58 | 0.15 |
| Fundamental Site Period, T0,XY | 1.74 | 0.15 |
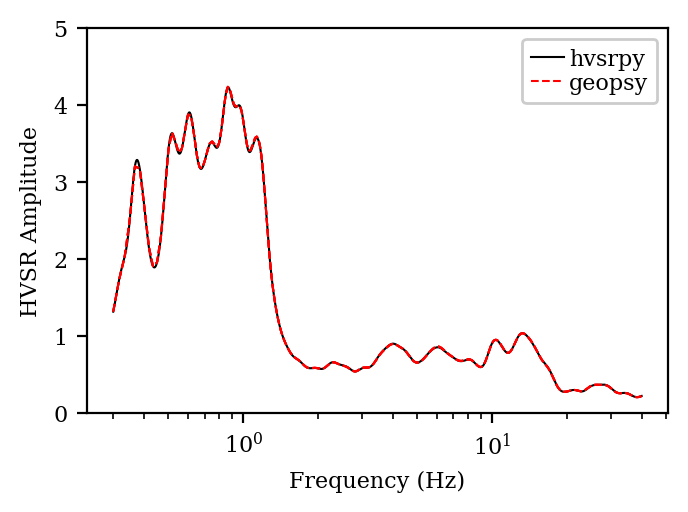
## A comparison of _hvsrpy_ with _Geopsy_
---
Some of the functionality available in `hvsrpy` overlaps with the popular
open-source software `Geopsy`. Therefore, to encourage standardization, wherever
their functionality coincides we have sought to ensure consistency. Two such
comparisons are shown below. One for a single time window (left) and one for
multiple time windows (right). Additional examples and the information
necessary to reproduce them are provided at the end of this document.
| | Lognormal Median | Lognormal Standard Deviation |
|-----------------------------------|------------------|------------------------------|
| Fundamental Site Frequency, f0,XY | 0.58 | 0.15 |
| Fundamental Site Period, T0,XY | 1.74 | 0.15 |
## A comparison of _hvsrpy_ with _Geopsy_
---
Some of the functionality available in `hvsrpy` overlaps with the popular
open-source software `Geopsy`. Therefore, to encourage standardization, wherever
their functionality coincides we have sought to ensure consistency. Two such
comparisons are shown below. One for a single time window (left) and one for
multiple time windows (right). Additional examples and the information
necessary to reproduce them are provided at the end of this document.
 ## Getting Started
---
### Installing or Upgrading _hvsrpy_
1. If you do not have Python 3.6 or later installed, you will need to do
so. A detailed set of instructions can be found
[here](https://jpvantassel.github.io/python3-course/#/intro/installing_python).
2. If you have not installed `hvsrpy` previously use `pip install hvsrpy`.
If you are not familiar with `pip`, a useful tutorial can be found
[here](https://jpvantassel.github.io/python3-course/#/intro/pip). If you have
an earlier version and would like to upgrade to the latest version of `hvsrpy`
use `pip install hvsrpy --upgrade`.
3. Confirm that `hvsrpy` has installed/updated successfully by examining the
last few lines of the text displayed in the console.
### Using _hvsrpy_
1. Download the contents of the [examples](https://github.com/jpvantassel/hvsrpy/tree/main/examples)
directory to any location of your choice.
2. Launch the Jupyter notebook (`simple_hvsrpy_interface.ipynb`) in the examples
directory for a no-coding-required introduction to the basics of the `hvsrpy`
package. If you have not installed `Jupyter`, detailed instructions can be
found [here](https://jpvantassel.github.io/python3-course/#/intro/installing_jupyter).
3. Launch the Jupyter notebook (`azimuthal_hvsrpy_interface.ipynb`) in the
examples directory to perform more rigorous calculations which incorporate
azimuthal variability.
4. Enjoy!
### Looking for more information
More information regarding HVSR processing and `hvsrpy` can be found
[here](https://github.com/jpvantassel/hvsrpy/blob/main/additional_information.md).
## Additional Comparisons between _hvsrpy_ and _Geopsy_
---
### Multiple Windows
The examples in this section use the same settings applied to different
noise records. The settings are provided in the __Settings__ section and the
name of each file is provided above the corresponding figure in the __Results__
section. The noise records (i.e., _.miniseed_ files) are provided in the
[examples](https://github.com/jpvantassel/hvsrpy/tree/main/examples) directory
and also as part of a large published data set
[(Cox and Vantassel, 2018)](https://www.designsafe-ci.org/data/browser/public/designsafe.storage.published//PRJ-2075/Thorndon%20Warf%20(A2)/Unprocessed%20Data/Microtremor%20Array%20Measurements%20(MAM)).
#### Settings
- __Window Length:__ 60 seconds
- __Bandpass Filter Boolean:__ False
- __Cosine Taper Width:__ 10% (i.e., 5% in Geopsy)
- __Konno and Ohmachi Smoothing Coefficient:__ 40
- __Resampling:__
- __Minimum Frequency:__ 0.3 Hz
- __Maximum Frequency:__ 40 Hz
- __Number of Points:__ 2048
- __Sampling Type:__ 'log'
- __Method for Combining Horizontal Components:__ 'squared-average'
- __Distribution for f0 from Time Windows:__ 'normal'
- __Distribution for Mean Curve:__ 'log-normal'
#### Multiple Window Results
__File Name:__ _UT.STN11.A2_C50.miniseed_
__File Name:__ _UT.STN11.A2_C150.miniseed_
## Getting Started
---
### Installing or Upgrading _hvsrpy_
1. If you do not have Python 3.6 or later installed, you will need to do
so. A detailed set of instructions can be found
[here](https://jpvantassel.github.io/python3-course/#/intro/installing_python).
2. If you have not installed `hvsrpy` previously use `pip install hvsrpy`.
If you are not familiar with `pip`, a useful tutorial can be found
[here](https://jpvantassel.github.io/python3-course/#/intro/pip). If you have
an earlier version and would like to upgrade to the latest version of `hvsrpy`
use `pip install hvsrpy --upgrade`.
3. Confirm that `hvsrpy` has installed/updated successfully by examining the
last few lines of the text displayed in the console.
### Using _hvsrpy_
1. Download the contents of the [examples](https://github.com/jpvantassel/hvsrpy/tree/main/examples)
directory to any location of your choice.
2. Launch the Jupyter notebook (`simple_hvsrpy_interface.ipynb`) in the examples
directory for a no-coding-required introduction to the basics of the `hvsrpy`
package. If you have not installed `Jupyter`, detailed instructions can be
found [here](https://jpvantassel.github.io/python3-course/#/intro/installing_jupyter).
3. Launch the Jupyter notebook (`azimuthal_hvsrpy_interface.ipynb`) in the
examples directory to perform more rigorous calculations which incorporate
azimuthal variability.
4. Enjoy!
### Looking for more information
More information regarding HVSR processing and `hvsrpy` can be found
[here](https://github.com/jpvantassel/hvsrpy/blob/main/additional_information.md).
## Additional Comparisons between _hvsrpy_ and _Geopsy_
---
### Multiple Windows
The examples in this section use the same settings applied to different
noise records. The settings are provided in the __Settings__ section and the
name of each file is provided above the corresponding figure in the __Results__
section. The noise records (i.e., _.miniseed_ files) are provided in the
[examples](https://github.com/jpvantassel/hvsrpy/tree/main/examples) directory
and also as part of a large published data set
[(Cox and Vantassel, 2018)](https://www.designsafe-ci.org/data/browser/public/designsafe.storage.published//PRJ-2075/Thorndon%20Warf%20(A2)/Unprocessed%20Data/Microtremor%20Array%20Measurements%20(MAM)).
#### Settings
- __Window Length:__ 60 seconds
- __Bandpass Filter Boolean:__ False
- __Cosine Taper Width:__ 10% (i.e., 5% in Geopsy)
- __Konno and Ohmachi Smoothing Coefficient:__ 40
- __Resampling:__
- __Minimum Frequency:__ 0.3 Hz
- __Maximum Frequency:__ 40 Hz
- __Number of Points:__ 2048
- __Sampling Type:__ 'log'
- __Method for Combining Horizontal Components:__ 'squared-average'
- __Distribution for f0 from Time Windows:__ 'normal'
- __Distribution for Mean Curve:__ 'log-normal'
#### Multiple Window Results
__File Name:__ _UT.STN11.A2_C50.miniseed_
__File Name:__ _UT.STN11.A2_C150.miniseed_
 __File Name:__ _UT.STN12.A2_C50.miniseed_
 __File Name:__ _UT.STN12.A2_C150.miniseed_
 ### Single Window
The examples in this section apply different settings to the same noise
record (_UT.STN11.A2_C50.miniseed_). For brevity, the default settings are
listed in the __Default Settings__ section, with only the variations from
these settings noted for each example.
#### Default Settings
- __Window Length:__ 60 seconds
- __Bandpass Filter Boolean:__ False
- __Cosine Taper Width:__ 10% (i.e., 5% in Geopsy)
- __Konno and Ohmachi Smoothing Coefficient:__ 40
- __Resampling:__
- __Minimum Frequency:__ 0.3 Hz
- __Maximum Frequency:__ 40 Hz
- __Number of Points:__ 2048
- __Sampling Type:__ 'log'
- __Method for Combining Horizontal Components:__ 'squared-average'
- __Distribution for f0 from Time Windows:__ 'normal'
- __Distribution for Mean Curve:__ 'log-normal'
#### Single Window Results
__Default Case:__ No variation from those settings listed above.
__Window Length:__ 120 seconds.
### Single Window
The examples in this section apply different settings to the same noise
record (_UT.STN11.A2_C50.miniseed_). For brevity, the default settings are
listed in the __Default Settings__ section, with only the variations from
these settings noted for each example.
#### Default Settings
- __Window Length:__ 60 seconds
- __Bandpass Filter Boolean:__ False
- __Cosine Taper Width:__ 10% (i.e., 5% in Geopsy)
- __Konno and Ohmachi Smoothing Coefficient:__ 40
- __Resampling:__
- __Minimum Frequency:__ 0.3 Hz
- __Maximum Frequency:__ 40 Hz
- __Number of Points:__ 2048
- __Sampling Type:__ 'log'
- __Method for Combining Horizontal Components:__ 'squared-average'
- __Distribution for f0 from Time Windows:__ 'normal'
- __Distribution for Mean Curve:__ 'log-normal'
#### Single Window Results
__Default Case:__ No variation from those settings listed above.
__Window Length:__ 120 seconds.
 __Cosine Taper Width:__ 20 % (i.e., 10 % in Geopsy)
 __Cosine Taper Width:__ 0.2 % (i.e., 0.1 % in Geopsy)
 __Konno and Ohmachi Smoothing Coefficient:__ 10
 __Konno and Ohmachi Smoothing Coefficient:__ 80
 __Number of Points:__ 512
 __Number of Points:__ 4096
