# clickhouse-datasource
**Repository Path**: wang-tf/clickhouse-datasource
## Basic Information
- **Project Name**: clickhouse-datasource
- **Description**: https://github.com/grafana/clickhouse-datasource
- **Primary Language**: Unknown
- **License**: Apache-2.0
- **Default Branch**: main
- **Homepage**: None
- **GVP Project**: No
## Statistics
- **Stars**: 0
- **Forks**: 0
- **Created**: 2025-08-18
- **Last Updated**: 2025-08-18
## Categories & Tags
**Categories**: Uncategorized
**Tags**: None
## README
# Official ClickHouse data source for Grafana
The ClickHouse data source plugin allows you to query and visualize ClickHouse data in Grafana.
 ## Version compatibility
Users on Grafana `v9.x` and higher of Grafana can use `v4`.
Users on Grafana `v8.x` are encouraged to continue using `v2.2.0` of the plugin.
\* *As of 2.0 this plugin will only support ad hoc filters when using ClickHouse 22.7+*
## Installation
For detailed instructions on how to install the plugin on Grafana Cloud or locally,
please checkout the [Plugin installation docs](https://grafana.com/docs/grafana/latest/plugins/installation/).
## Configuration
### ClickHouse user for the data source
Set up an ClickHouse user account with [readonly](https://clickhouse.com/docs/en/operations/settings/permissions-for-queries#settings_readonly) permission and access to
databases and tables you want to query.
Please note that Grafana does not validate that queries are safe. Queries can contain any SQL statement.
For example, statements like `ALTER TABLE system.users DELETE WHERE name='sadUser'`
and `DROP TABLE sadTable;` would be executed.
To configure a readonly user, follow these steps:
1. Create a `readonly` user profile following the [Creating Users and Roles in ClickHouse](https://clickhouse.com/docs/en/operations/access-rights) guide.
2. Ensure the `readonly` user has enough permission to modify the `max_execution_time` setting required by the underlying [clickhouse-go client](https://github.com/ClickHouse/clickhouse-go/).
3. If you're using a public Clickhouse instance, it's not recommended to set `readonly=2` in the `readonly` profile. Instead, leave `readonly=1` and set the constraint type of `max_execution_time` to [changeable_in_readonly](https://clickhouse.com/docs/en/operations/settings/constraints-on-settings) to allow modification of this setting.
### ClickHouse protocol support
The plugin supports both `Native` (default) and `HTTP` transport protocols.
This can be enabled in the configuration via the `protocol` configuration parameter.
Both protocols exchange data with ClickHouse using optimized native format.
Note that the default ports for `HTTP/S` and `Native` differ:
- HTTP - 8123
- HTTPS - 8443
- Native - 9000
- Native with TLS - 9440
### Manual configuration via UI
Once the plugin is installed on your Grafana instance, follow
[these instructions](https://grafana.com/docs/grafana/latest/datasources/add-a-data-source/)
to add a new ClickHouse data source, and enter configuration options.
### With a configuration file
It is possible to configure data sources using configuration files with Grafana’s provisioning system.
To read about how it works, refer to
[Provisioning Grafana data sources](https://grafana.com/docs/grafana/latest/administration/provisioning/#data-sources).
Here are some provisioning examples for this data source using basic authentication:
```yaml
apiVersion: 1
datasources:
- name: ClickHouse
type: grafana-clickhouse-datasource
jsonData:
defaultDatabase: database
port: 9000
host: localhost
username: username
tlsSkipVerify: false
# tlsAuth:
# tlsAuthWithCACert:
# secure:
# dialTimeout:
# queryTimeout:
# protocol:
# defaultTable:
# httpHeaders:
# - name: X-Example-Header
# secure: false
# value:
# - name: Authorization
# secure: true
# logs:
# defaultDatabase:
# defaultTable:
# otelEnabled:
# otelVersion:
# timeColumn:
# ...Column:
# traces:
# defaultDatabase:
# defaultTable:
# otelEnabled:
# otelVersion:
# durationUnit:
# traceIdColumn:
# ...Column:
secureJsonData:
password: password
# tlsCACert:
# tlsClientCert:
# tlsClientKey:
# secureHttpHeaders.Authorization:
```
## Building queries
Queries can be built using the raw SQL editor or the query builder.
Queries can contain macros which simplify syntax and allow for
dynamic SQL generation.
### Time series
Time series visualization options are selectable after adding a `datetime`
field type to your query. This field will be used as the timestamp. You can
select time series visualizations using the visualization options. Grafana
interprets timestamp rows without explicit time zone as UTC. Any column except
`time` is treated as a value column.
#### Multi-line time series
To create multi-line time series, the query must return at least 3 fields in
the following order:
- field 1: `datetime` field with an alias of `time`
- field 2: value to group by
- field 3+: the metric values
For example:
```sql
SELECT log_time AS time, machine_group, avg(disk_free) AS avg_disk_free
FROM mgbench.logs1
GROUP BY machine_group, log_time
ORDER BY log_time
```
### Tables
Table visualizations will always be available for any valid ClickHouse query.
### Visualizing logs with the Logs Panel
To use the Logs panel your query must return a timestamp and string values. To default to the logs visualization in Explore mode, set the timestamp alias to *log_time*.
For example:
```sql
SELECT log_time AS log_time, machine_group, toString(avg(disk_free)) AS avg_disk_free
FROM logs1
GROUP BY machine_group, log_time
ORDER BY log_time
```
To force rendering as logs, in absence of a `log_time` column, set the Format to `Logs` (available from 2.2.0).
### Visualizing traces with the Traces Panel
Ensure your data meets the [requirements of the traces panel](https://grafana.com/docs/grafana/latest/explore/trace-integration/#data-api). This applies if using the visualization or Explore view.
Set the Format to `Trace` when constructing the query (available from 2.2.0).
If using the [Open Telemetry Collector and ClickHouse exporter](https://github.com/open-telemetry/opentelemetry-collector-contrib/tree/main/exporter/clickhouseexporter), the following query produces the required column names (these are case sensitive):
```sql
SELECT
TraceId AS traceID,
SpanId AS spanID,
SpanName AS operationName,
ParentSpanId AS parentSpanID,
ServiceName AS serviceName,
Duration / 1000000 AS duration,
Timestamp AS startTime,
arrayMap(key -> map('key', key, 'value', SpanAttributes[key]), mapKeys(SpanAttributes)) AS tags,
arrayMap(key -> map('key', key, 'value', ResourceAttributes[key]), mapKeys(ResourceAttributes)) AS serviceTags,
if(StatusCode IN ('Error', 'STATUS_CODE_ERROR'), 2, 0) AS statusCode
FROM otel.otel_traces
WHERE TraceId = '61d489320c01243966700e172ab37081'
ORDER BY startTime ASC
```
### Macros
To simplify syntax and to allow for dynamic parts, like date range filters, the query can contain macros.
Here is an example of a query with a macro that will use Grafana's time filter:
```sql
SELECT date_time, data_stuff
FROM test_data
WHERE $__timeFilter(date_time)
```
| Macro | Description | Output example |
|----------------------------------------------|-------------------------------------------------------------------------------------------------------------------------------------------------------------------------------------|-------------------------------------------------------------------------------------------------------|
| *$__dateFilter(columnName)* | Replaced by a conditional that filters the data (using the provided column) based on the date range of the panel | `date >= toDate('2022-10-21') AND date <= toDate('2022-10-23')` |
| *$__timeFilter(columnName)* | Replaced by a conditional that filters the data (using the provided column) based on the time range of the panel in seconds | `time >= toDateTime(1415792726) AND time <= toDateTime(1447328726)` |
| *$__timeFilter_ms(columnName)* | Replaced by a conditional that filters the data (using the provided column) based on the time range of the panel in milliseconds | `time >= fromUnixTimestamp64Milli(1415792726123) AND time <= fromUnixTimestamp64Milli(1447328726456)` |
| *$__dateTimeFilter(dateColumn, timeColumn)* | Shorthand that combines $__dateFilter() AND $__timeFilter() using separate Date and DateTime columns. | `$__dateFilter(dateColumn) AND $__timeFilter(timeColumn)` |
| *$__fromTime* | Replaced by the starting time of the range of the panel casted to `DateTime` | `toDateTime(1415792726)` |
| *$__toTime* | Replaced by the ending time of the range of the panel casted to `DateTime` | `toDateTime(1447328726)` |
| *$__fromTime_ms* | Replaced by the starting time of the range of the panel casted to `DateTime64(3)` | `fromUnixTimestamp64Milli(1415792726123)` |
| *$__toTime_ms* | Replaced by the ending time of the range of the panel casted to `DateTime64(3)` | `fromUnixTimestamp64Milli(1447328726456)` |
| *$__interval_s* | Replaced by the interval in seconds | `20` |
| *$__timeInterval(columnName)* | Replaced by a function calculating the interval based on window size in seconds, useful when grouping | `toStartOfInterval(toDateTime(column), INTERVAL 20 second)` |
| *$__timeInterval_ms(columnName)* | Replaced by a function calculating the interval based on window size in milliseconds, useful when grouping | `toStartOfInterval(toDateTime64(column, 3), INTERVAL 20 millisecond)` |
| *$__conditionalAll(condition, $templateVar)* | Replaced by the first parameter when the template variable in the second parameter does not select every value. Replaced by the 1=1 when the template variable selects every value. | `condition` or `1=1` |
The plugin also supports notation using braces {}. Use this notation when queries are needed inside parameters.
### Templates and variables
To add a new ClickHouse query variable, refer to [Add a query
variable](https://grafana.com/docs/grafana/latest/variables/variable-types/add-query-variable/).
After creating a variable, you can use it in your ClickHouse queries by using
[Variable syntax](https://grafana.com/docs/grafana/latest/variables/syntax/).
For more information about variables, refer to [Templates and
variables](https://grafana.com/docs/grafana/latest/variables/).
### Importing dashboards for ClickHouse
Follow these
[instructions](https://grafana.com/docs/grafana/latest/dashboards/export-import/#import-dashboard)
to import a dashboard.
You can also find available, pre-made dashboards by navigating to the data
sources configuration page, selecting the ClickHouse data source and clicking
on the Dashboards tab.
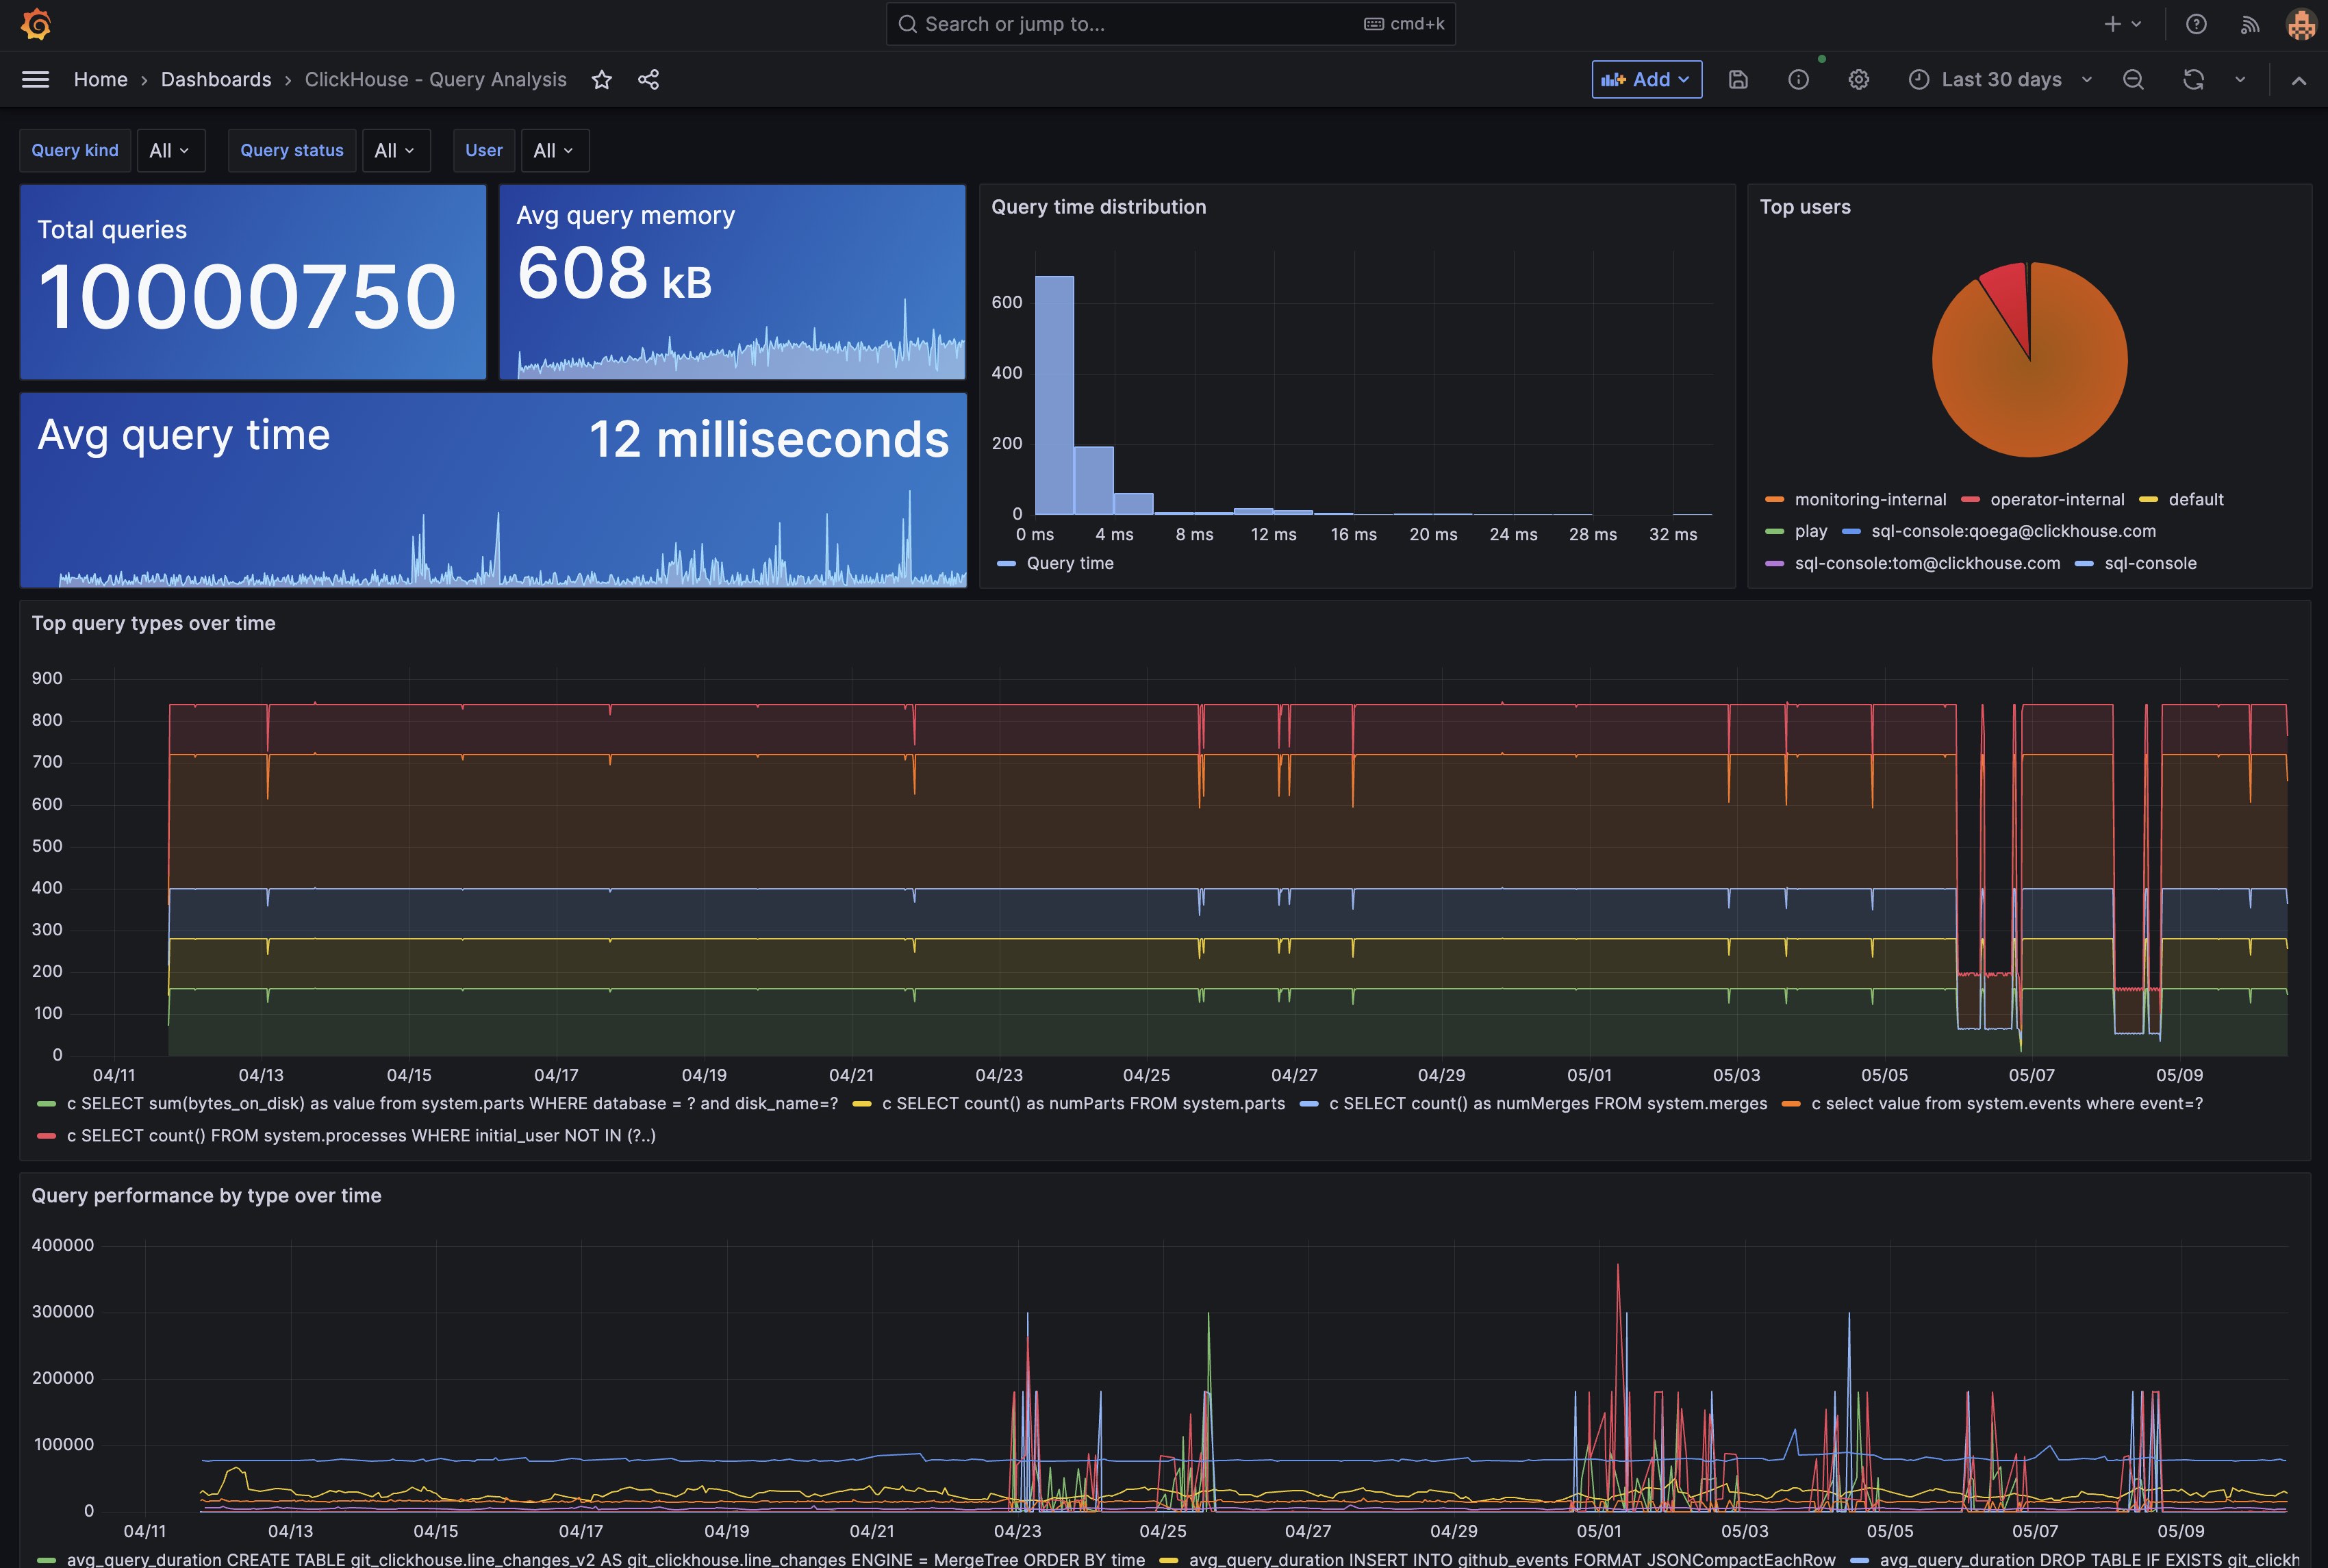
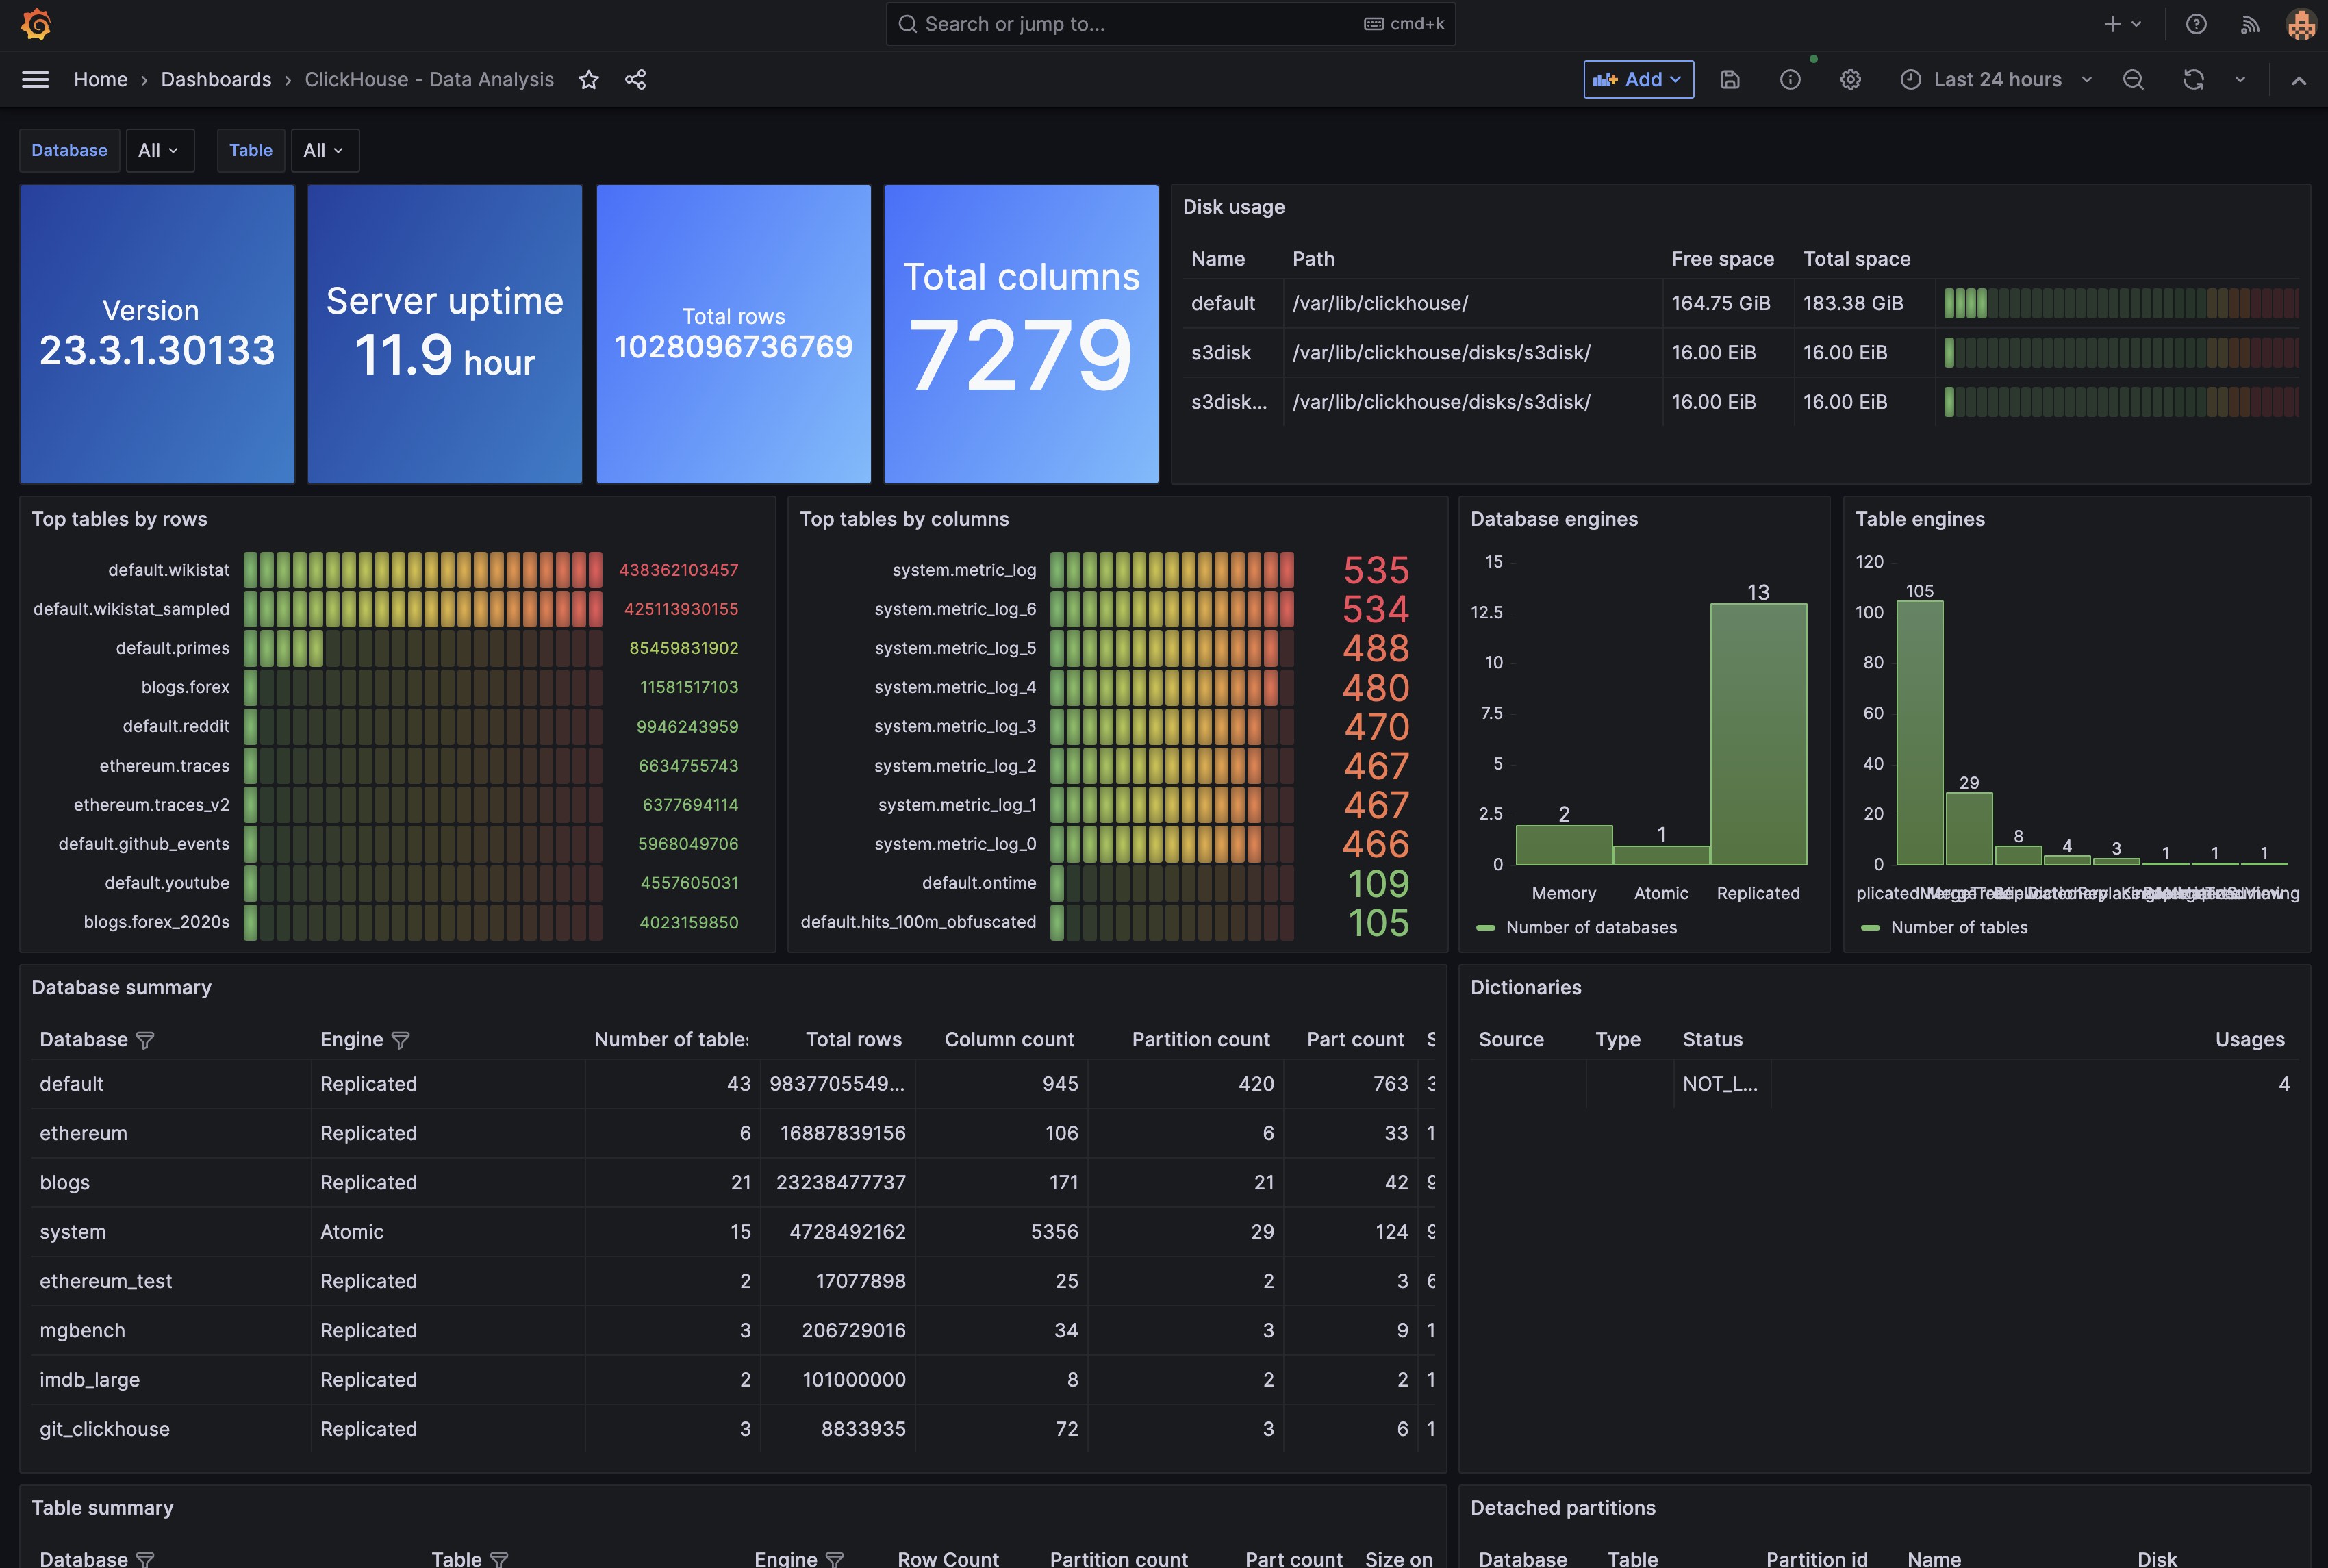
We distribute the following dashboards with the plugin. These are aimed at assisting with support analysis of a ClickHouse cluster and do not rely on external datasets. The querying user requires access to the `system` database.
1. Cluster Analysis - an overview of configured clusters, merges, mutations and data replication.
2. Data Analysis - an overview of current databases and tables, including their respective sizes, partitions and parts.
3. Query Analysis - an analysis of queries by type, performance and resource consumption.
### Ad Hoc Filters
Ad hoc filters are only supported with version 22.7+ of ClickHouse.
Ad hoc filters allow you to add key/value filters that are automatically added
to all metric queries that use the specified data source, without being
explicitly used in queries.
By default, Ad Hoc filters will be populated with all Tables and Columns. If
you have a default database defined in the Datasource settings, all Tables from
that database will be used to populate the filters. As this could be
slow/expensive, you can introduce a second variable to allow limiting the
Ad Hoc filters. It should be a `constant` type named `clickhouse_adhoc_query`
and can contain: a comma delimited list of databases, just one database, or a
database.table combination to show only columns for a single table.
For more information on Ad Hoc filters, check the [Grafana
docs](https://grafana.com/docs/grafana/latest/variables/variable-types/add-ad-hoc-filters/)
#### Using a query for Ad Hoc filters
The second `clickhouse_adhoc_query` also allows any valid Clickhouse query. The
query results will be used to populate your ad-hoc filter's selectable filters.
You may choose to hide this variable from view as it serves no further purpose.
For example, if `clickhouse_adhoc_query` is set to `SELECT DISTINCT
machine_name FROM mgbench.logs1` you would be able to select which machine
names are filtered for in the dashboard.
## Learn more
* Add [Annotations](https://grafana.com/docs/grafana/latest/dashboards/annotations/).
* Configure and use [Templates and variables](https://grafana.com/docs/grafana/latest/variables/).
* Add [Transformations](https://grafana.com/docs/grafana/latest/panels/transformations/).
* Set up alerting; refer to [Alerts overview](https://grafana.com/docs/grafana/latest/alerting/).
## Version compatibility
Users on Grafana `v9.x` and higher of Grafana can use `v4`.
Users on Grafana `v8.x` are encouraged to continue using `v2.2.0` of the plugin.
\* *As of 2.0 this plugin will only support ad hoc filters when using ClickHouse 22.7+*
## Installation
For detailed instructions on how to install the plugin on Grafana Cloud or locally,
please checkout the [Plugin installation docs](https://grafana.com/docs/grafana/latest/plugins/installation/).
## Configuration
### ClickHouse user for the data source
Set up an ClickHouse user account with [readonly](https://clickhouse.com/docs/en/operations/settings/permissions-for-queries#settings_readonly) permission and access to
databases and tables you want to query.
Please note that Grafana does not validate that queries are safe. Queries can contain any SQL statement.
For example, statements like `ALTER TABLE system.users DELETE WHERE name='sadUser'`
and `DROP TABLE sadTable;` would be executed.
To configure a readonly user, follow these steps:
1. Create a `readonly` user profile following the [Creating Users and Roles in ClickHouse](https://clickhouse.com/docs/en/operations/access-rights) guide.
2. Ensure the `readonly` user has enough permission to modify the `max_execution_time` setting required by the underlying [clickhouse-go client](https://github.com/ClickHouse/clickhouse-go/).
3. If you're using a public Clickhouse instance, it's not recommended to set `readonly=2` in the `readonly` profile. Instead, leave `readonly=1` and set the constraint type of `max_execution_time` to [changeable_in_readonly](https://clickhouse.com/docs/en/operations/settings/constraints-on-settings) to allow modification of this setting.
### ClickHouse protocol support
The plugin supports both `Native` (default) and `HTTP` transport protocols.
This can be enabled in the configuration via the `protocol` configuration parameter.
Both protocols exchange data with ClickHouse using optimized native format.
Note that the default ports for `HTTP/S` and `Native` differ:
- HTTP - 8123
- HTTPS - 8443
- Native - 9000
- Native with TLS - 9440
### Manual configuration via UI
Once the plugin is installed on your Grafana instance, follow
[these instructions](https://grafana.com/docs/grafana/latest/datasources/add-a-data-source/)
to add a new ClickHouse data source, and enter configuration options.
### With a configuration file
It is possible to configure data sources using configuration files with Grafana’s provisioning system.
To read about how it works, refer to
[Provisioning Grafana data sources](https://grafana.com/docs/grafana/latest/administration/provisioning/#data-sources).
Here are some provisioning examples for this data source using basic authentication:
```yaml
apiVersion: 1
datasources:
- name: ClickHouse
type: grafana-clickhouse-datasource
jsonData:
defaultDatabase: database
port: 9000
host: localhost
username: username
tlsSkipVerify: false
# tlsAuth:
# tlsAuthWithCACert:
# secure:
# dialTimeout:
# queryTimeout:
# protocol:
# defaultTable:
# httpHeaders:
# - name: X-Example-Header
# secure: false
# value:
# - name: Authorization
# secure: true
# logs:
# defaultDatabase:
# defaultTable:
# otelEnabled:
# otelVersion:
# timeColumn:
# ...Column:
# traces:
# defaultDatabase:
# defaultTable:
# otelEnabled:
# otelVersion:
# durationUnit:
# traceIdColumn:
# ...Column:
secureJsonData:
password: password
# tlsCACert:
# tlsClientCert:
# tlsClientKey:
# secureHttpHeaders.Authorization:
```
## Building queries
Queries can be built using the raw SQL editor or the query builder.
Queries can contain macros which simplify syntax and allow for
dynamic SQL generation.
### Time series
Time series visualization options are selectable after adding a `datetime`
field type to your query. This field will be used as the timestamp. You can
select time series visualizations using the visualization options. Grafana
interprets timestamp rows without explicit time zone as UTC. Any column except
`time` is treated as a value column.
#### Multi-line time series
To create multi-line time series, the query must return at least 3 fields in
the following order:
- field 1: `datetime` field with an alias of `time`
- field 2: value to group by
- field 3+: the metric values
For example:
```sql
SELECT log_time AS time, machine_group, avg(disk_free) AS avg_disk_free
FROM mgbench.logs1
GROUP BY machine_group, log_time
ORDER BY log_time
```
### Tables
Table visualizations will always be available for any valid ClickHouse query.
### Visualizing logs with the Logs Panel
To use the Logs panel your query must return a timestamp and string values. To default to the logs visualization in Explore mode, set the timestamp alias to *log_time*.
For example:
```sql
SELECT log_time AS log_time, machine_group, toString(avg(disk_free)) AS avg_disk_free
FROM logs1
GROUP BY machine_group, log_time
ORDER BY log_time
```
To force rendering as logs, in absence of a `log_time` column, set the Format to `Logs` (available from 2.2.0).
### Visualizing traces with the Traces Panel
Ensure your data meets the [requirements of the traces panel](https://grafana.com/docs/grafana/latest/explore/trace-integration/#data-api). This applies if using the visualization or Explore view.
Set the Format to `Trace` when constructing the query (available from 2.2.0).
If using the [Open Telemetry Collector and ClickHouse exporter](https://github.com/open-telemetry/opentelemetry-collector-contrib/tree/main/exporter/clickhouseexporter), the following query produces the required column names (these are case sensitive):
```sql
SELECT
TraceId AS traceID,
SpanId AS spanID,
SpanName AS operationName,
ParentSpanId AS parentSpanID,
ServiceName AS serviceName,
Duration / 1000000 AS duration,
Timestamp AS startTime,
arrayMap(key -> map('key', key, 'value', SpanAttributes[key]), mapKeys(SpanAttributes)) AS tags,
arrayMap(key -> map('key', key, 'value', ResourceAttributes[key]), mapKeys(ResourceAttributes)) AS serviceTags,
if(StatusCode IN ('Error', 'STATUS_CODE_ERROR'), 2, 0) AS statusCode
FROM otel.otel_traces
WHERE TraceId = '61d489320c01243966700e172ab37081'
ORDER BY startTime ASC
```
### Macros
To simplify syntax and to allow for dynamic parts, like date range filters, the query can contain macros.
Here is an example of a query with a macro that will use Grafana's time filter:
```sql
SELECT date_time, data_stuff
FROM test_data
WHERE $__timeFilter(date_time)
```
| Macro | Description | Output example |
|----------------------------------------------|-------------------------------------------------------------------------------------------------------------------------------------------------------------------------------------|-------------------------------------------------------------------------------------------------------|
| *$__dateFilter(columnName)* | Replaced by a conditional that filters the data (using the provided column) based on the date range of the panel | `date >= toDate('2022-10-21') AND date <= toDate('2022-10-23')` |
| *$__timeFilter(columnName)* | Replaced by a conditional that filters the data (using the provided column) based on the time range of the panel in seconds | `time >= toDateTime(1415792726) AND time <= toDateTime(1447328726)` |
| *$__timeFilter_ms(columnName)* | Replaced by a conditional that filters the data (using the provided column) based on the time range of the panel in milliseconds | `time >= fromUnixTimestamp64Milli(1415792726123) AND time <= fromUnixTimestamp64Milli(1447328726456)` |
| *$__dateTimeFilter(dateColumn, timeColumn)* | Shorthand that combines $__dateFilter() AND $__timeFilter() using separate Date and DateTime columns. | `$__dateFilter(dateColumn) AND $__timeFilter(timeColumn)` |
| *$__fromTime* | Replaced by the starting time of the range of the panel casted to `DateTime` | `toDateTime(1415792726)` |
| *$__toTime* | Replaced by the ending time of the range of the panel casted to `DateTime` | `toDateTime(1447328726)` |
| *$__fromTime_ms* | Replaced by the starting time of the range of the panel casted to `DateTime64(3)` | `fromUnixTimestamp64Milli(1415792726123)` |
| *$__toTime_ms* | Replaced by the ending time of the range of the panel casted to `DateTime64(3)` | `fromUnixTimestamp64Milli(1447328726456)` |
| *$__interval_s* | Replaced by the interval in seconds | `20` |
| *$__timeInterval(columnName)* | Replaced by a function calculating the interval based on window size in seconds, useful when grouping | `toStartOfInterval(toDateTime(column), INTERVAL 20 second)` |
| *$__timeInterval_ms(columnName)* | Replaced by a function calculating the interval based on window size in milliseconds, useful when grouping | `toStartOfInterval(toDateTime64(column, 3), INTERVAL 20 millisecond)` |
| *$__conditionalAll(condition, $templateVar)* | Replaced by the first parameter when the template variable in the second parameter does not select every value. Replaced by the 1=1 when the template variable selects every value. | `condition` or `1=1` |
The plugin also supports notation using braces {}. Use this notation when queries are needed inside parameters.
### Templates and variables
To add a new ClickHouse query variable, refer to [Add a query
variable](https://grafana.com/docs/grafana/latest/variables/variable-types/add-query-variable/).
After creating a variable, you can use it in your ClickHouse queries by using
[Variable syntax](https://grafana.com/docs/grafana/latest/variables/syntax/).
For more information about variables, refer to [Templates and
variables](https://grafana.com/docs/grafana/latest/variables/).
### Importing dashboards for ClickHouse
Follow these
[instructions](https://grafana.com/docs/grafana/latest/dashboards/export-import/#import-dashboard)
to import a dashboard.
You can also find available, pre-made dashboards by navigating to the data
sources configuration page, selecting the ClickHouse data source and clicking
on the Dashboards tab.
We distribute the following dashboards with the plugin. These are aimed at assisting with support analysis of a ClickHouse cluster and do not rely on external datasets. The querying user requires access to the `system` database.
1. Cluster Analysis - an overview of configured clusters, merges, mutations and data replication.
2. Data Analysis - an overview of current databases and tables, including their respective sizes, partitions and parts.
3. Query Analysis - an analysis of queries by type, performance and resource consumption.
### Ad Hoc Filters
Ad hoc filters are only supported with version 22.7+ of ClickHouse.
Ad hoc filters allow you to add key/value filters that are automatically added
to all metric queries that use the specified data source, without being
explicitly used in queries.
By default, Ad Hoc filters will be populated with all Tables and Columns. If
you have a default database defined in the Datasource settings, all Tables from
that database will be used to populate the filters. As this could be
slow/expensive, you can introduce a second variable to allow limiting the
Ad Hoc filters. It should be a `constant` type named `clickhouse_adhoc_query`
and can contain: a comma delimited list of databases, just one database, or a
database.table combination to show only columns for a single table.
For more information on Ad Hoc filters, check the [Grafana
docs](https://grafana.com/docs/grafana/latest/variables/variable-types/add-ad-hoc-filters/)
#### Using a query for Ad Hoc filters
The second `clickhouse_adhoc_query` also allows any valid Clickhouse query. The
query results will be used to populate your ad-hoc filter's selectable filters.
You may choose to hide this variable from view as it serves no further purpose.
For example, if `clickhouse_adhoc_query` is set to `SELECT DISTINCT
machine_name FROM mgbench.logs1` you would be able to select which machine
names are filtered for in the dashboard.
## Learn more
* Add [Annotations](https://grafana.com/docs/grafana/latest/dashboards/annotations/).
* Configure and use [Templates and variables](https://grafana.com/docs/grafana/latest/variables/).
* Add [Transformations](https://grafana.com/docs/grafana/latest/panels/transformations/).
* Set up alerting; refer to [Alerts overview](https://grafana.com/docs/grafana/latest/alerting/).