

代码拉取完成,页面将自动刷新
In this article, we'll show different ways to capture a heap dump in Java.
A heap dump is a snapshot of all the objects that are in memory in the JVM at a certain moment.
They are very useful to troubleshoot memory-leak problems and optimize memory usage in Java applications.
Heap dumps are usually stored in binary format hprof files.
We can open and analyze these files using tools like jhat or JVisualVM. Also, for Eclipse users it's very common to use MAT.
In the next sections, we'll go through multiple tools and approaches to generate a heap dump and we'll show the main differences between them.
堆内存转储(Heap Dump),是指JVM堆内存在某一个时刻的快照,一般使用 hprof 格式的二进制文件来保存。 可用于分析内存泄漏问题,以及Java程序的内存使用优化。
常见的内存转储分析工具包括: jhat, JVisualVM, 以及基于Eclipse的 MAT工具.
下面介绍获取堆内存转储的常用方法。
The JDK comes with several tools to capture heap dumps in different ways.
All these tools are located under the
binfolder inside the JDK home directory.
Therefore, we can start them from the command line as long as this directory is included in the system path.
In the next sections, we'll show how to use these tools in order to capture heap dumps.
JDK内置了很多诊断工具,位于 JDK_HOME/bin 目录下,一般来说这个目录可以包含到系统PATH路径中,可以直接在命令行中调用。
JDK内置的堆内存转储工具包括:
jmap is a tool to print statistics about the memory in a running JVM. We can use it for local or remote processes.
To capture a heap dump using jmap we need to use the dump option:
jmap 工具jmap 可用来输出JVM内存的统计信息,支持访问本地JVM,以及远程JVM实例。
使用 -dump 选项来获取堆内存转储,命令为:
jmap -dump:[live],format=b,file=<file-path> <pid>
Along with that option, we should specify several parameters:
live: if set it only prints objects which have active references and discards the ones that are ready to be garbage collected. This parameter is optionalformat=b: specifies that the dump file will be in binary format. If not set the result is the samefile: the file where the dump will be written topid: id of the Java processAn example would be like this:
在 -dump: 选项后面, 可以指定以下参数:
live: 可选参数;表示只输出存活对象,也就是会先执行一次FullGC来清除可以被回收的部分。format=b: 可选参数, 指定 dump 文件为二进制格式(binary format). 在堆内存转储时,默认就是二进制格式。file: 指定转储文件的保存路径。pid: 指定Java进程的pid。使用示例如下:
jmap -dump:live,format=b,file=/tmp/dump.hprof 12587
# 或者
jmap -dump:file=/tmp/dump.hprof 12587
Remember that we can easily get the pid of a Java process by using the jps command.
Keep in mind that jmap was introduced in the JDK as an experimental tool and it's unsupported.
Therefore, in some cases, it may be preferable to use other tools instead.
JVM进程的 pid 一般是通过 jps 命令获取,当然也可以使用通过 jcmd 命令,或者 ps 命令查询。
jcmd is a very complete tool which works by sending command requests to the JVM. We have to use it in the same machine where the Java process is running.
One of its many commands is the
GC.heap_dump.
We can use it to get a heap dump just by specifying the pid of the process and the output file path:
jcmd 工具jcmd 是一个全能的命令行诊断工具,其工作原理是将要执行的命令发送给具体的JVM实例,所以只支持在本地机器上使用。
其中的一个命令是 GC.heap_dump, 可以用来获取堆内存转储,只需要指定 pid 即可,命令格式为:
jcmd <pid> GC.heap_dump <file-path>
We can execute it with the same parameters that we used before:
使用示例也类似:
jcmd 12587 GC.heap_dump /tmp/dump.hprof
As with jmap, the dump generated is in binary format.
和 jmap 一样,内存转储文件都是二进制的。 因为是把命令当做参数传给具体的JVM来执行,所以文件路径最好是绝对路径。
JVisualVM is a tool with a graphical user interface that lets us monitor, troubleshoot and profile Java applications.
The GUI is simple but very intuitive and easy to use.
One of its many options allows us to capture a heap dump. If we right-click on a Java process and select the “Heap Dump” option, the tool will create a heap dump and open it in a new tab:
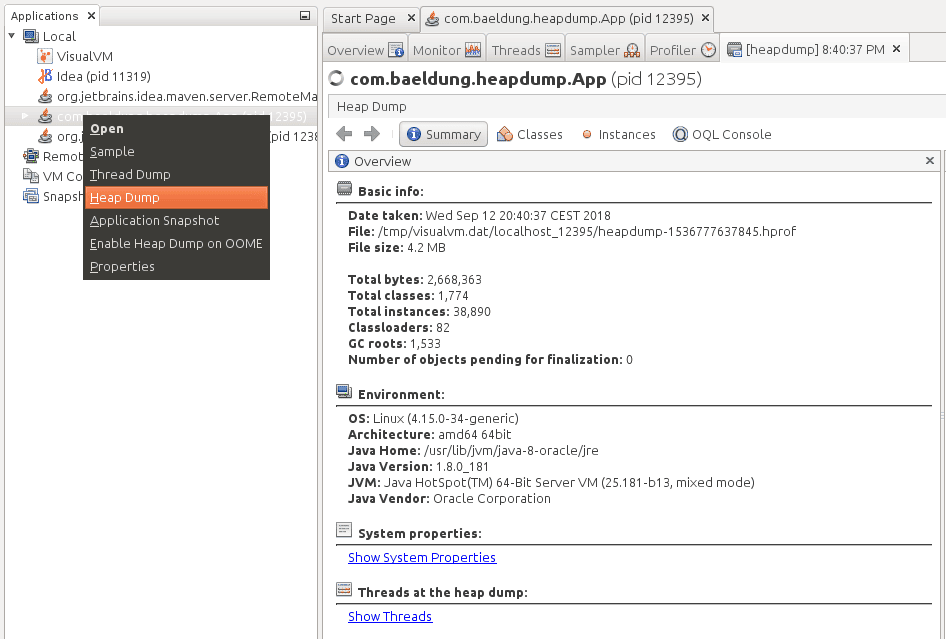
Notice that we can find the path of the file created in the “Basic Info” section.
JVisualVM是一款图形界面工具,可用来监控、分析和诊断Java应用程序。
图形界面简单优雅,而且功能强大,支持众多插件。
其中的一个功能是抓取堆内存快照,打开程序,在可见的Java进程上点击鼠标右键,选择“堆内存转储(Heap Dump)”, 即可创建新的内存转储文件,并自动在新标签页中打开。
完成之后,我们可以在基本信息(Basic Info)中看到转储文件的目录信息。
All the tools that we've shown in the previous sections are intended to capture heap dumps manually at a specific time. In some cases, we want to get a heap dump when a java.lang.OutOfMemoryError occurs so it helps us investigate the error.
For these cases, Java provides the HeapDumpOnOutOfMemoryError command-line option that generates a heap dump when a java.lang.OutOfMemoryError is thrown:
前面介绍的工具都是手工执行的,有时候,我们希望在发生内存溢出错误 java.lang.OutOfMemoryError 时, JVM自动执行堆内存转储,以方便事后进行排查和分析。 JVM提供了一个命令行启动参数 HeapDumpOnOutOfMemoryError, 使用的格式为:
java -XX:+HeapDumpOnOutOfMemoryError
By default, it stores the dump in a java_pid.hprof file in the directory where we're running the application. If we want to specify another file or directory we can set it in the HeapDumpPath option:
如果不用 HeapDumpPath 选项指定转储路径,则会自动保存到启动目录下,文件名的格式为: java_pid<pid>.hprof。
指定 HeapDumpPath 参数的使用示例如下:
java -XX:+HeapDumpOnOutOfMemoryError -XX:HeapDumpPath=<file-or-dir-path>
When our application runs out of memory using this option, we'll be able to see in the logs the created file that contains the heap dump:
Java程序在运行过程中如果发生内存溢出,则会在日志中看到类似这样的内容:
java.lang.OutOfMemoryError: Requested array size exceeds VM limit
Dumping heap to java_pid12587.hprof ...
Exception in thread "main" Heap dump file created [4744371 bytes in 0.029 secs]
java.lang.OutOfMemoryError: Requested array size exceeds VM limit
    at com.baeldung.heapdump.App.main(App.java:7)
In the example above, it was written to the java_pid12587.hprof file.
As we can see, this option is very useful and there is no overhead when running an application with this option. Therefore, it's highly recommended to use this option always, especially in production.
Finally, this option can also be specified at runtime by using the HotSpotDiagnostic MBean. To do so, we can use JConsole and set the HeapDumpOnOutOfMemoryError VM option to true:
这里自动创建的转储文件名称为 java_pid12587.hprof。
可以看到,这个选项非常有用,而且对正常运行的程序来说没有什么开销。 因此强烈建议开启该选项,特别是在生产环境中。
当然,这个选项也可以通过 HotSpotDiagnostic MBean 来动态设置,比如在JMX客户端之中设置 HeapDumpOnOutOfMemoryError 选项的值为 true:

We can find more information about MBeans and JMX in this article.
MBeans 和 JMX 的更多信息请参考: https://www.baeldung.com/java-management-extensions
The last approach that we'll cover in this article is using JMX. We'll use the HotSpotDiagnostic MBean that we briefly introduced in the previous section. This MBean provides a dumpHeap method that accepts 2 parameters:
outputFile: the path of the file for the dump. The file should have the hprof extensionlive: if set to true it dumps only the active objects in memory, as we've seen with jmap beforeIn the next sections, we'll show 2 different ways to invoke this method in order to capture a heap dump.
最后,我们来看看怎么通过JMX方式获取堆内存转储。 本质上是调用 HotSpotDiagnostic 这个MBean,其提供了一个 dumpHeap 方法, 参数为:
outputFile: 转储文件的路径, 一般以 .hprof 后缀结尾。live: 如果设置为 true, 则只转储存活对象, 和 jmap 的使用类似。下面是使用示例:
JConsole
The easiest way to use the HotSpotDiagnostic MBean is by using a JMX client such as JConsole.
If we open JConsole and connect to a running Java process, we can navigate to the MBeans tab and find the HotSpotDiagnostic under com.sun.management. In operations, we can find the dumpHeap method that we've described before:
HotSpotDiagnostic MBean 最容易操作的方式是图形界面客户端, 例如 JConsole, JVisualVM 等。
打开 JConsole, 连接到指定的Java进程, 切换到 MBeans 页签, 定位到 com.sun.management. 包下面的 HotSpotDiagnostic, 执行对应的 dumpHeap 方法即可。
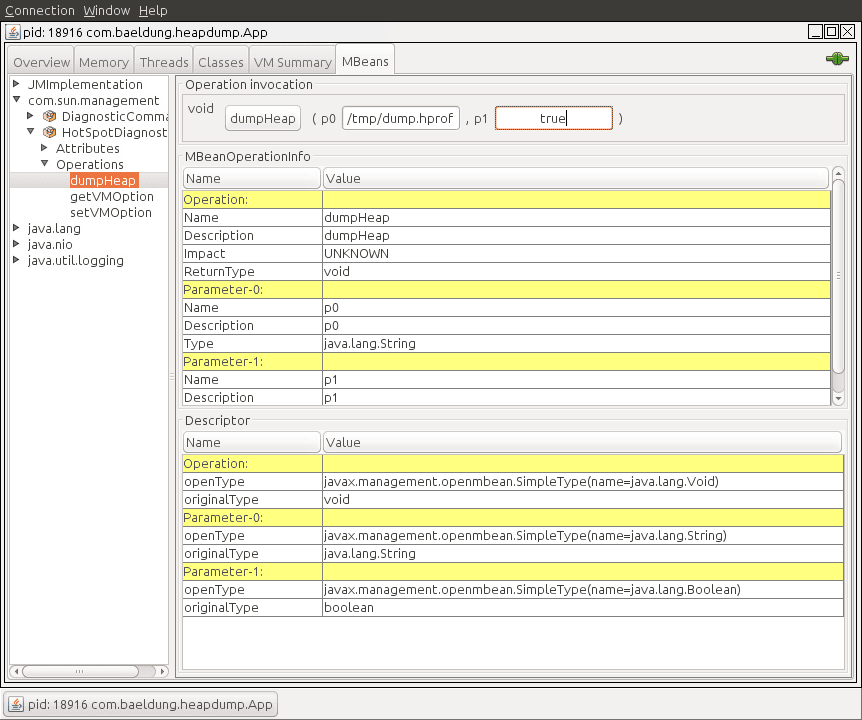
As shown, we just need to introduce the parameters outputFile and live into the p0 and p1 text fields in order to perform the dumpHeap operation.
然后在 p0 和 p1 槽位填写对应的参数 outputFile, live, 执行 dumpHeap 即可。
The other way to use the HotSpotDiagnostic MBean is by invoking it programmatically from Java code.
To do so, we first need to get an MBeanServer instance in order to get an MBean that is registered in the application. After that, we simply need to get an instance of a HotSpotDiagnosticMXBean and call its dumpHeap method.
Let's see it in code:
首先,需要获取 MBeanServer 实例,然后再获取系统注册的 HotSpotDiagnosticMXBean MBean, 接着调用 dumpHeap 方法, 示例代码如下:
public static void dumpHeap(String filePath, boolean live) throws IOException {
    MBeanServer server = ManagementFactory.getPlatformMBeanServer();
    HotSpotDiagnosticMXBean mxBean = ManagementFactory.newPlatformMXBeanProxy(
      server, "com.sun.management:type=HotSpotDiagnostic", HotSpotDiagnosticMXBean.class);
    mxBean.dumpHeap(filePath, live);
}
Notice that an hprof file cannot be overwritten. Therefore, we should take this into account when creating an application that prints heap dumps. If we fail to do so we'll get an exception:
请注意 hprof 文件不能被覆盖, 如果文件已存在,则会报错:
Exception in thread "main" java.io.IOException: File exists
    at sun.management.HotSpotDiagnostic.dumpHeap0(Native Method)
    at sun.management.HotSpotDiagnostic.dumpHeap(HotSpotDiagnostic.java:60)
In this tutorial, we've shown multiple ways to capture a heap dump in Java.
As a rule of thumb, we should remember to use the HeapDumpOnOutOfMemoryError option always when running Java applications. For other purposes, any of the other tools can be perfectly used as long as we keep in mind the unsupported status of jmap.
As always, the full source code of the examples is available over on GitHub.
本文介绍了几种获取堆内存转储的方法。 简单总结一下:
HeapDumpOnOutOfMemoryError.jmap 不能使用,可以使用其他的替代方式,例如 jcmd、JVisualVM、JMX等等。此处可能存在不合适展示的内容,页面不予展示。您可通过相关编辑功能自查并修改。
如您确认内容无涉及 不当用语 / 纯广告导流 / 暴力 / 低俗色情 / 侵权 / 盗版 / 虚假 / 无价值内容或违法国家有关法律法规的内容,可点击提交进行申诉,我们将尽快为您处理。


