# leaflet操作文档
**Repository Path**: dxdsuper/leaflet
## Basic Information
- **Project Name**: leaflet操作文档
- **Description**: No description available
- **Primary Language**: JavaScript
- **License**: Not specified
- **Default Branch**: master
- **Homepage**: None
- **GVP Project**: No
## Statistics
- **Stars**: 52
- **Forks**: 5
- **Created**: 2021-05-13
- **Last Updated**: 2025-03-21
## Categories & Tags
**Categories**: Uncategorized
**Tags**: None
## README
# leaflet_doc
#### 介绍
leallet技术文档
#### 软件架构
Csdn 地址:https://blog.csdn.net/qq_40423339/article/details/106080464?spm=1001.2014.3001.5502
Csdn 地址2: https://blog.csdn.net/qq_40423339/article/details/106098966?spm=1001.2014.3001.5502
#### 安装教程
1. 下载node
2. npm install
3. 运行 npm run dev
#### 使用说明
1. 访问 ip+port/notebook1
2. 访问 ip+port/notebook2
3. 访问 ip+port/notebook3
4. 访问 ip+port/notebook4
# 下载leaflet与leaflet.pm
leaflet 用于根据坐标自动绘制等操作,leaflet.pm可实现用户手动绘制。
leaflet.pm 参考网址:https://www.npmjs.com/package/leaflet.pm
leaflet 参考网址:https://leafletjs.com/reference-1.6.0.html
```
npm install leaflet.pm
npm install leaflet
```
# 引入,在项目main.js中
```js
import 'leaflet/dist/leaflet.css'
// 引入Leaflet对象 挂载到Vue上,便于全局使用,也可以单独页面中单独引用
import * as L from 'leaflet'
import 'leaflet.pm'
import 'leaflet.pm/dist/leaflet.pm.css'
Vue.config.productionTip = false;
Vue.L = Vue.prototype.$L = L
/* leaflet icon */
delete L.Icon.Default.prototype._getIconUrl
L.Icon.Default.mergeOptions({
iconRetinaUrl: require('leaflet/dist/images/marker-icon-2x.png'),
iconUrl: require('leaflet/dist/images/marker-icon.png'),
shadowUrl: require('leaflet/dist/images/marker-shadow.png'),
})
```
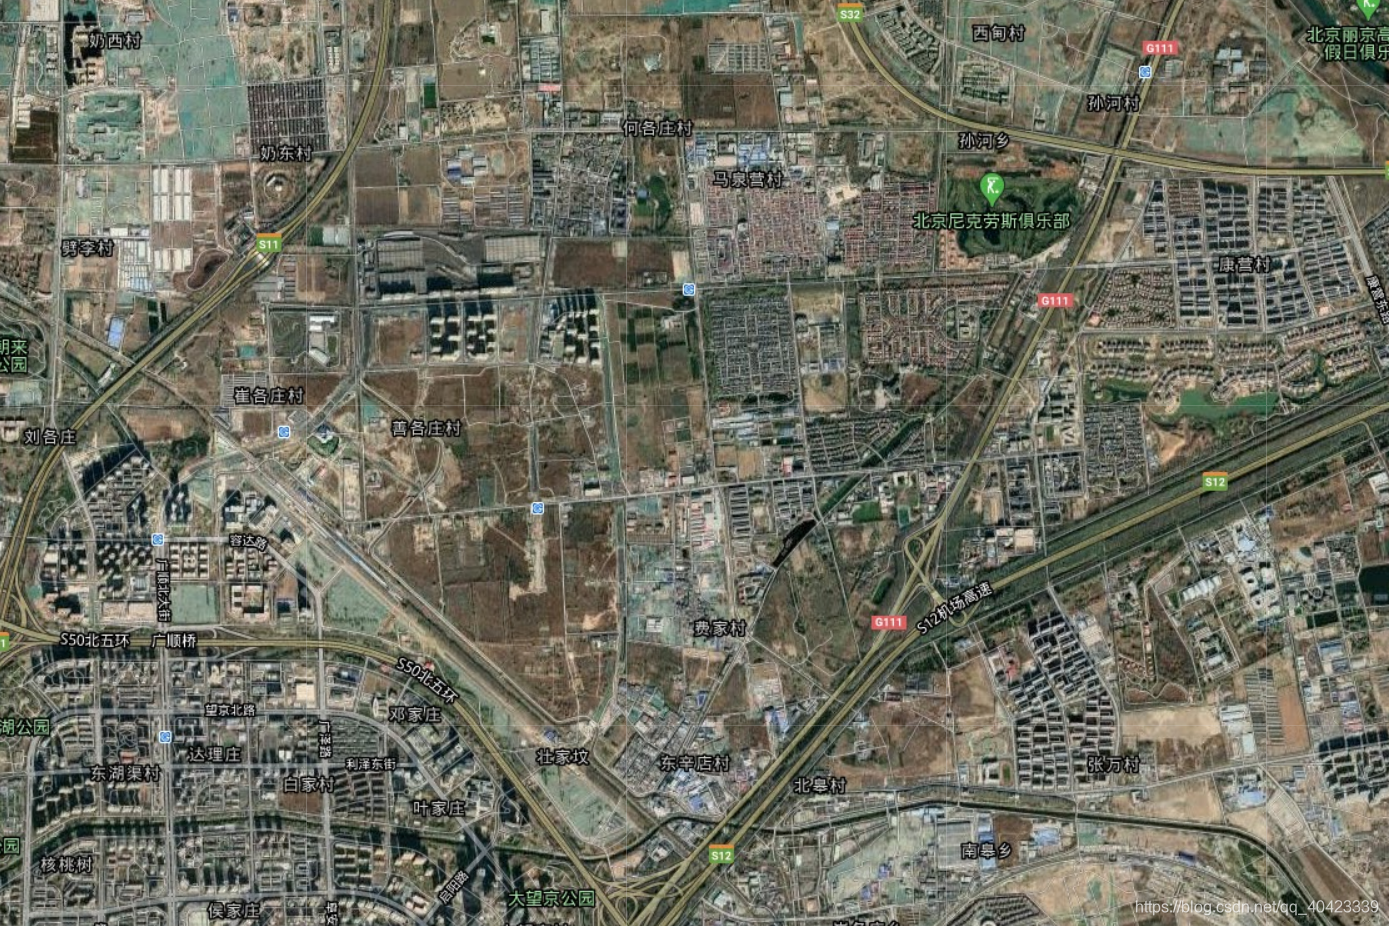
# 初始化地图
## 初始化
```
map = L.map('map',{
center: [40.02404009136253, 116.50641060224784], // 地图中心
zoom: 14, //缩放比列
zoomControl: false, //禁用 + - 按钮
doubleClickZoom: false, // 禁用双击放大
attributionControl: false // 移除右下角leaflet标识
});
```
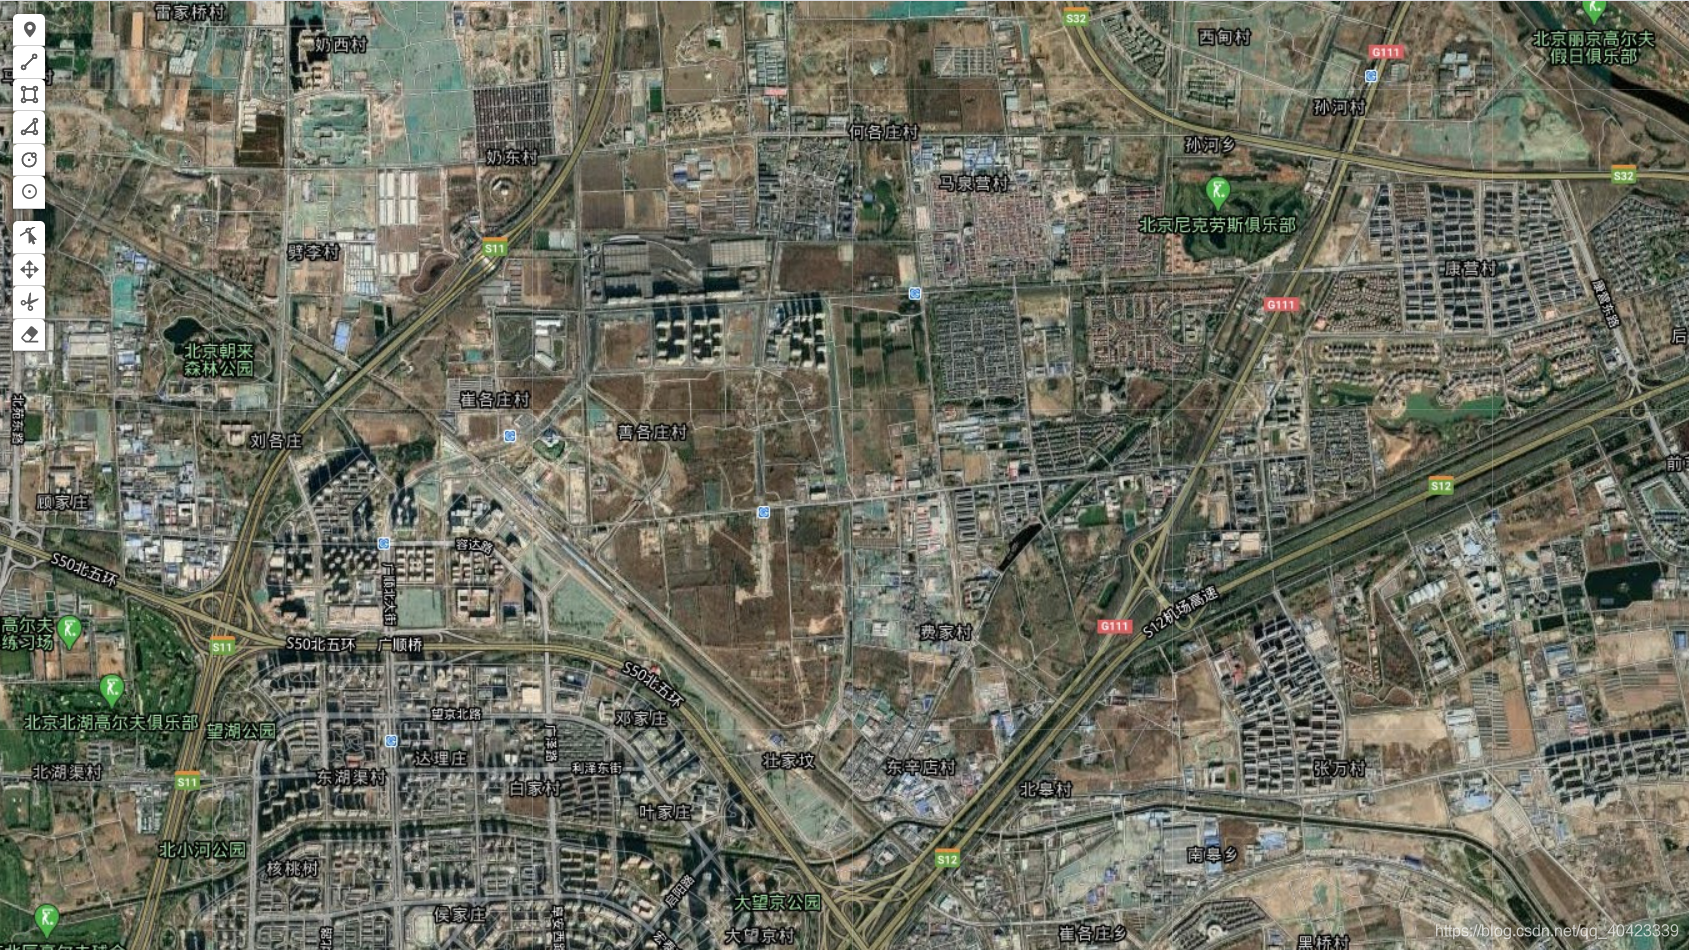
## 引入图层,可以引入多个图层
```js
L.tileLayer(
"http://mt0.google.cn/vt/lyrs=y@160000000&hl=zh-CN&gl=CN&src=app&y={y}&x={x}&z={z}&s=Ga",
).addTo(this.map);
```
## 初始化综合代码
```js
```
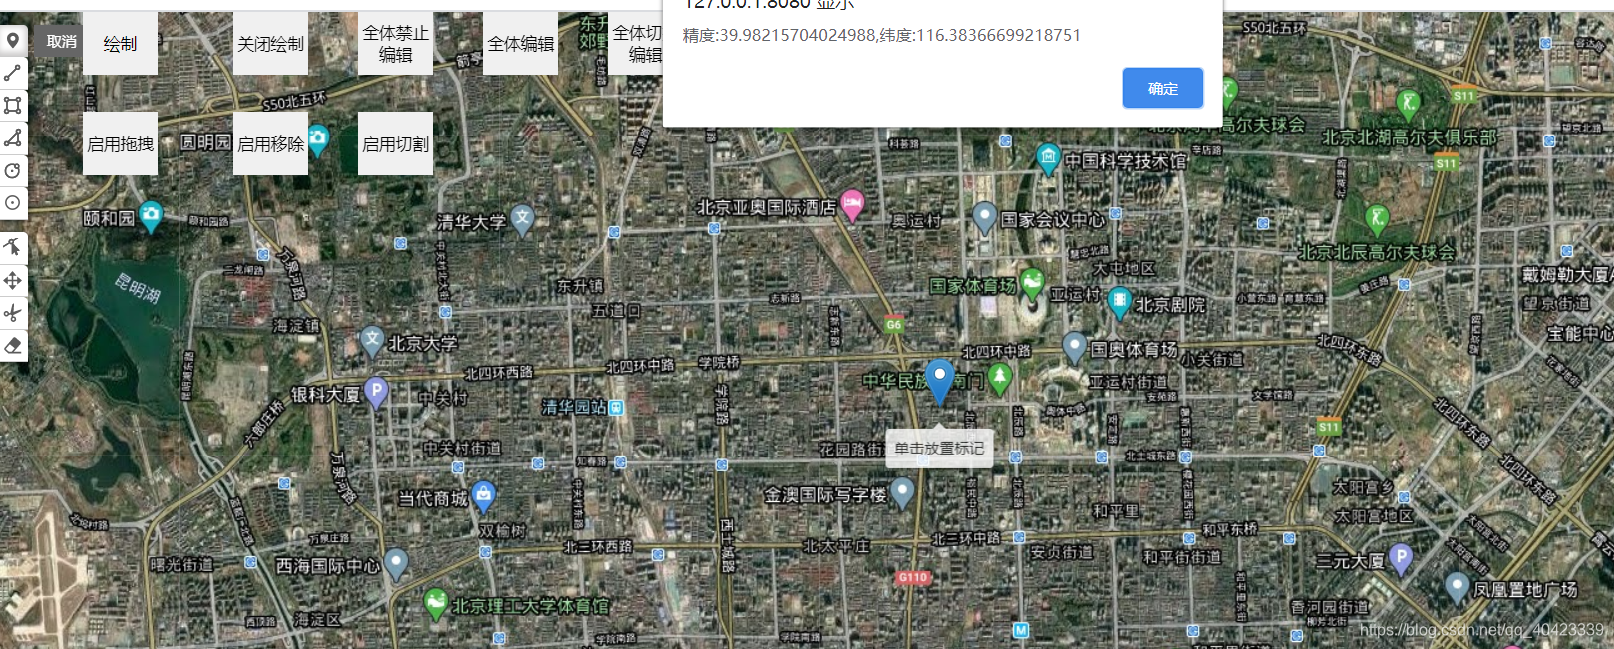
# 添加绘制按钮功能及获取对应坐标
## 引入leafle.pm原生组件
```js
this.map.pm.addControls({
position: "topleft",
drawPolygon: false, // 添加绘制多边形
drawMarker: false, //添加按钮以绘制标记
drawCircleMarker: false, //添加按钮以绘制圆形标记
drawPolyline: false, //添加按钮绘制线条
drawRectangle: true, //添加按钮绘制矩形
drawCircle: false, // 添加按钮绘制圆圈
editMode: true, // 添加按钮编辑多边形
dragMode: true, // 添加按钮拖动多边形
cutPolygon: true, // 添加一个按钮以删除图层里面的部分内容
removalMode: true // 清除图层
});
// 设置绘制后的线条颜色等
this.map.pm.setPathOptions({
color: "orange",
fillColor: "green",
fillOpacity: 0.4
});
this.map.pm.setLang('zh'); //设置语言 en, de, it, ru, ro, es, fr, pt_br, zh , nl
```
## 绑定自己的按钮
```js