1 Star 0 Fork 2

lbenw / TuChart

forked from Tang / TuChart 
加入 Gitee
与超过 1200万 开发者一起发现、参与优秀开源项目,私有仓库也完全免费 :)
免费加入
克隆/下载
贡献代码
同步代码
取消
提示: 由于 Git 不支持空文件夾,创建文件夹后会生成空的 .keep 文件
Loading...
README
MIT

TuChart Downloads

TuChart is a visualization tool for the Chinese stock market, based on Tushare and Echarts.
中文文档

Examples

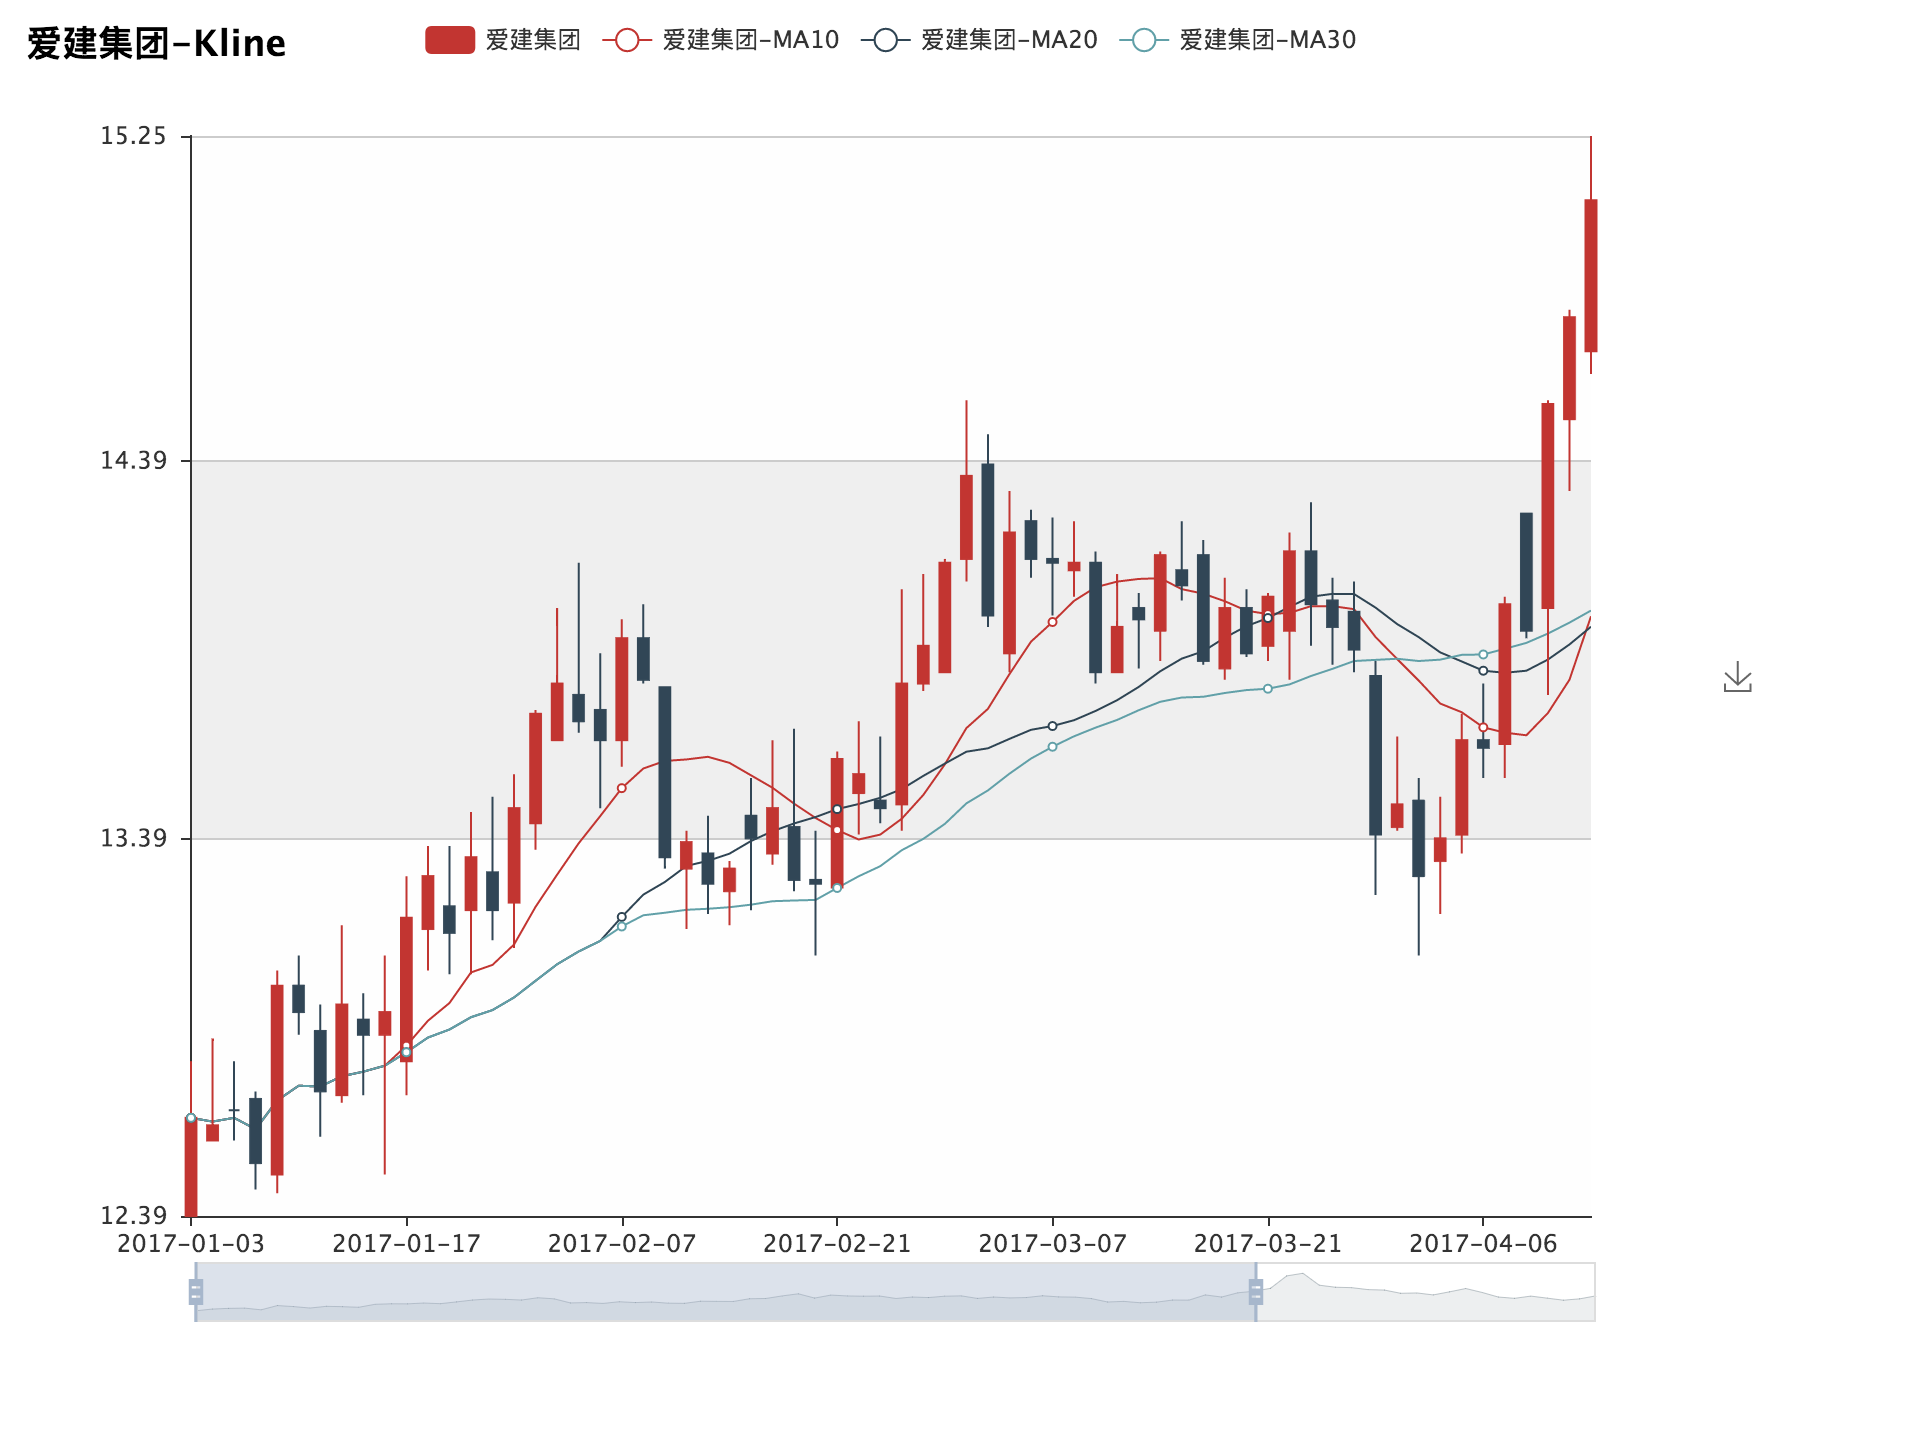
Candlestick Charts

notebook-0

Tick Charts

notebook-0

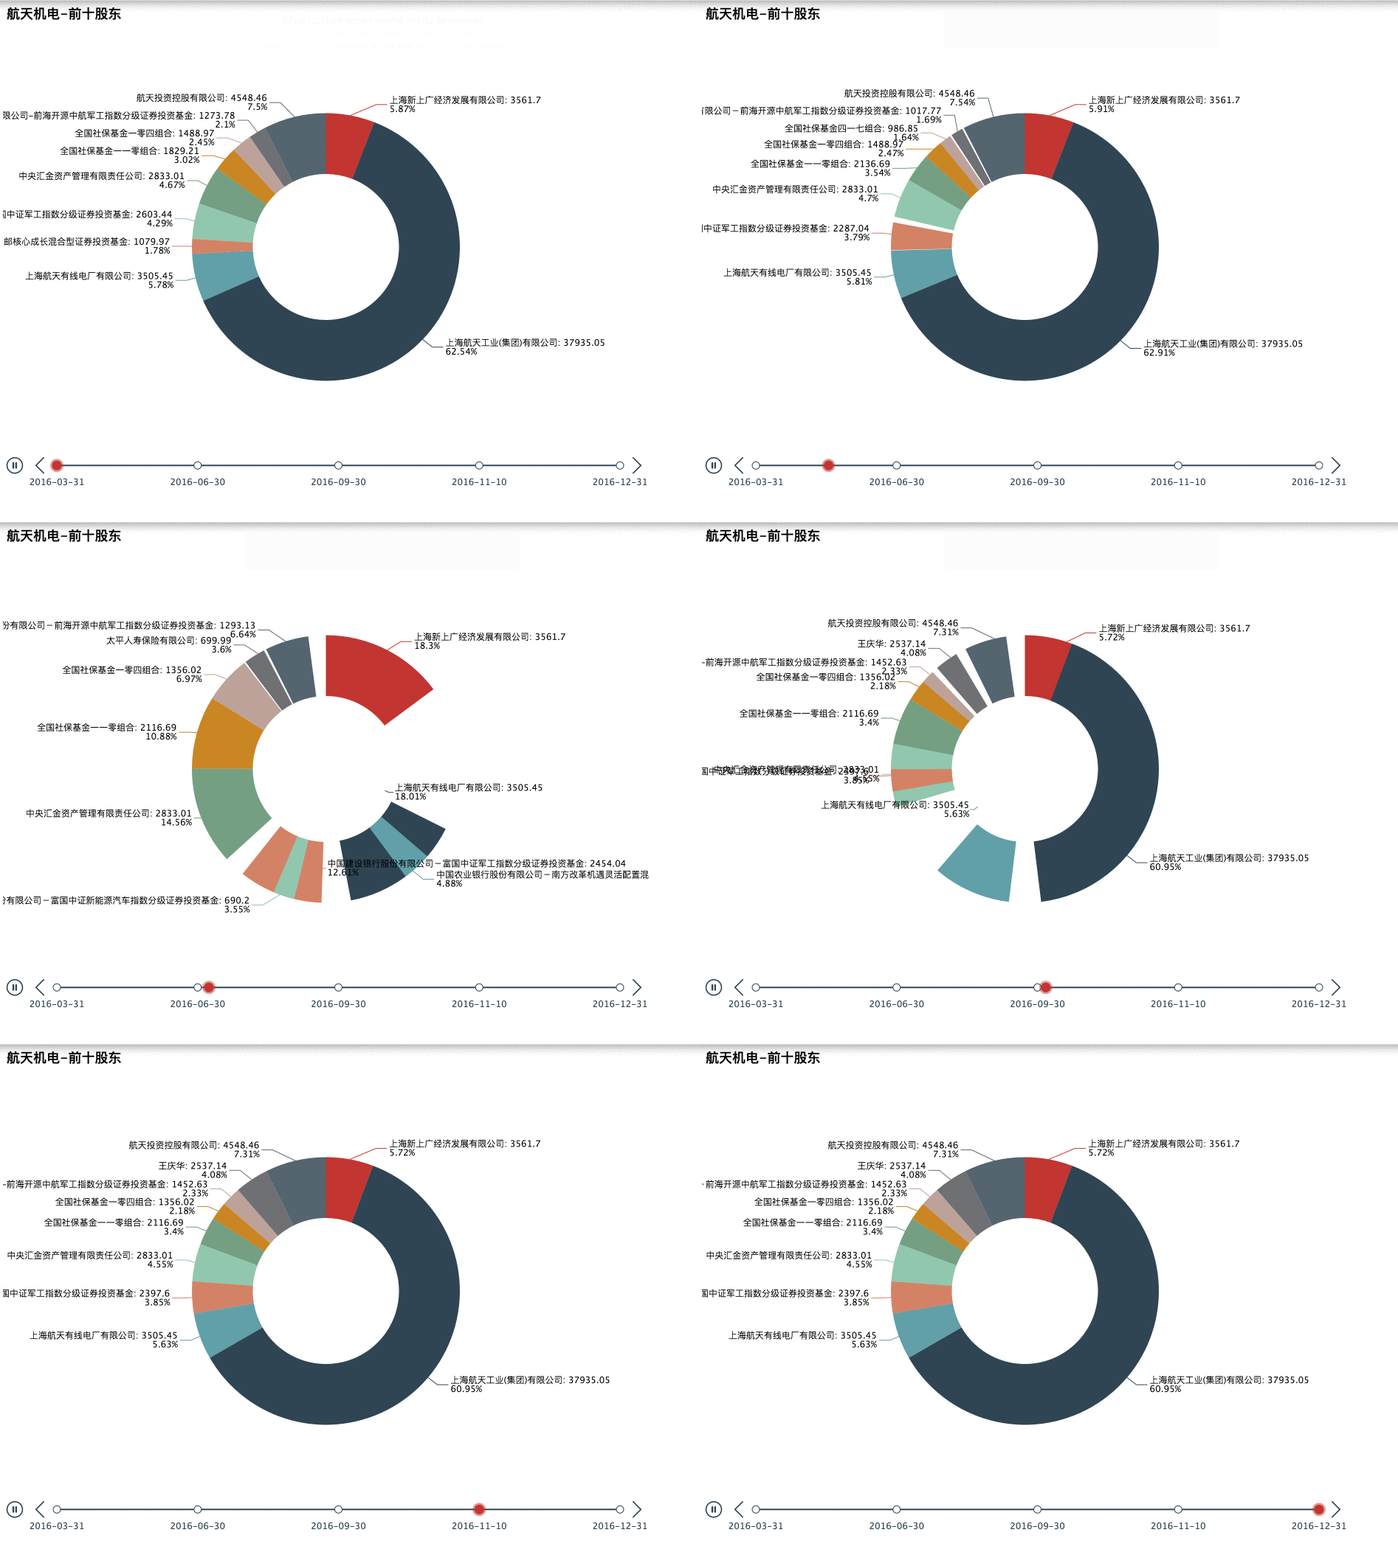
Major Shareholders

notebook-0

Supports dragging and zooming

notebook-0

Setup Instructions

Install all necessary dependencies

pip install pyecharts==0.2.0

pip install tushare==0.8.6

To install Tuchart, enter pip install tuchart in your terminal

Notice:For best plotting experience,please download the latest version = 0.1.2.7

then, under your tuchart directory, e.g:

/user/anaconda/lib/python2.7/site-packages/tuchart

runpython main.py

The exact path of tuchart in your directory can be located bypip show tuchart: notebook-0 add/tuchartto pinpoint the tuchart directory.

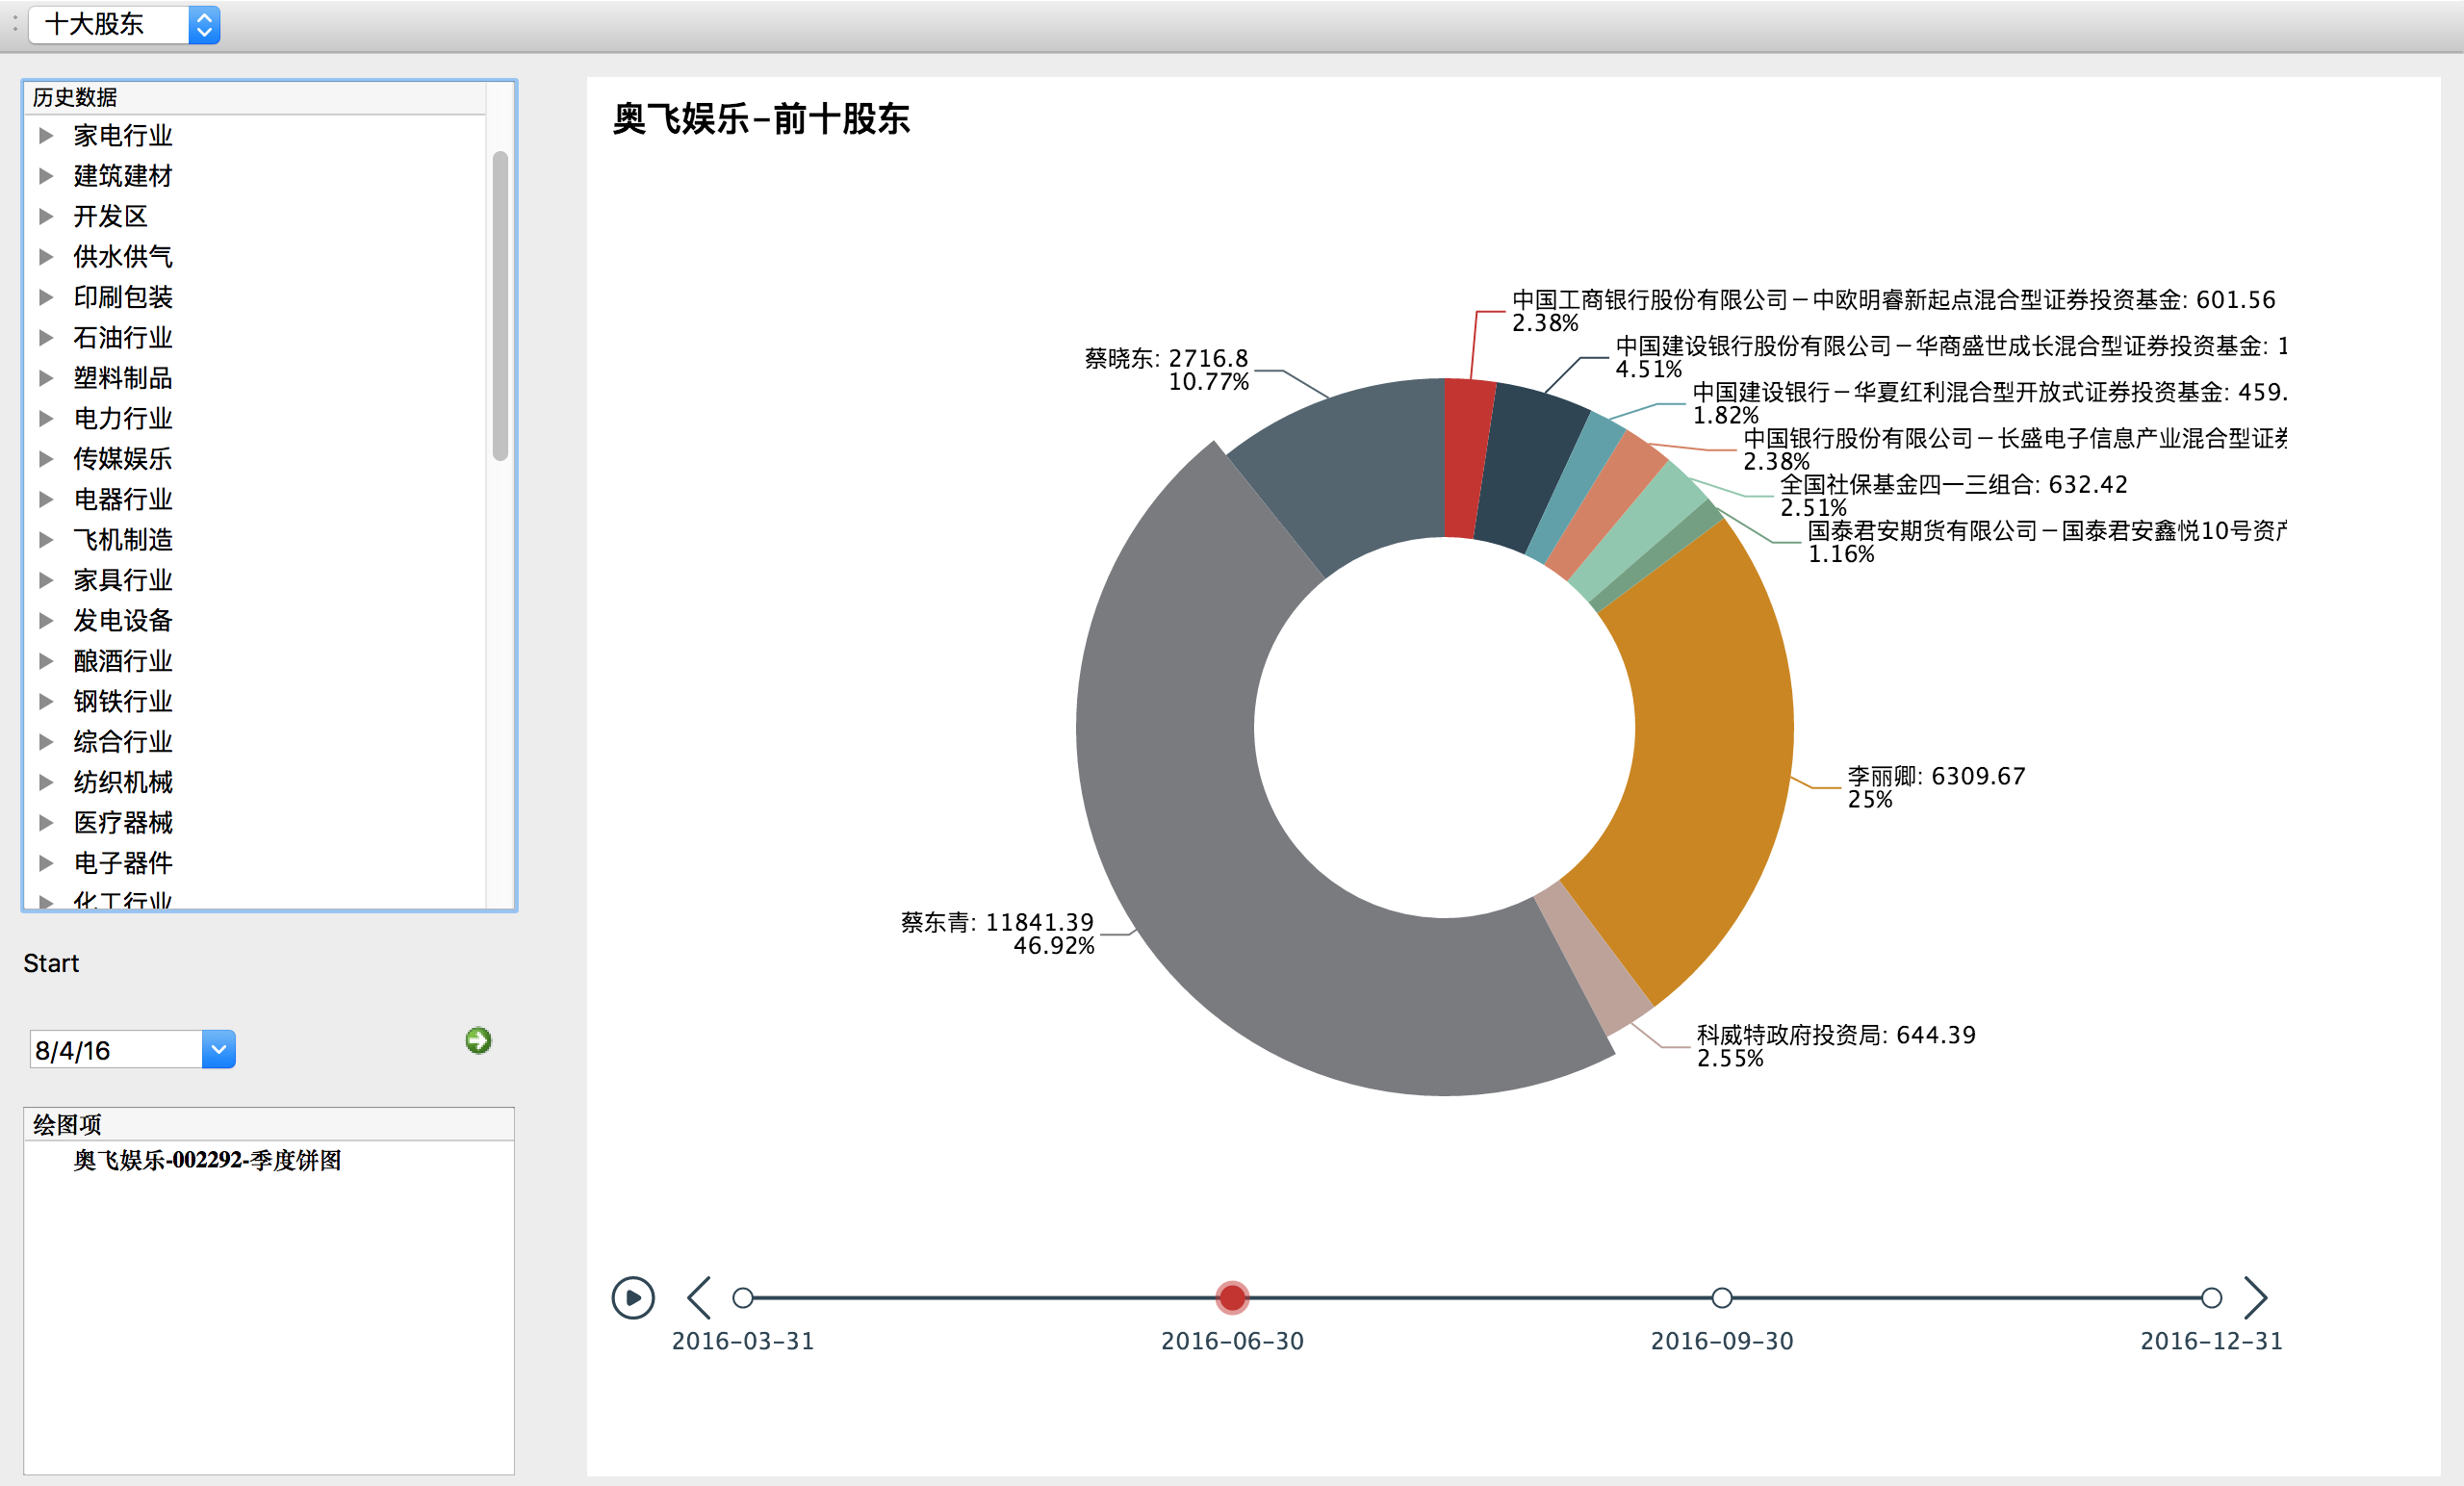
Right click to choose the name of stock and type of data you would like to plot. Then, press the green arrow button to plot. Due to the size constraints, it is recommended to plot fewer than 5 graphs at the same time.

Manual

Tuchart Currently Supports:

  • Raw Stock Data
    • Daily average
    • Weekly average
    • Monthly average
    • 15 minute average
    • 30 minute average
  • Restoration Data
    • Daily average
    • Weekly average
    • Monthly average
    • 15 minute average
    • 30 minute average
  • Tick data of individual stocks
  • High frequency data within one day

High frequency data is calculated from tick data of your chosen day. Algorithm: 如何用TICK数据生成分钟线数据

  • Distribution of Top Shareholders

Tuchart will return data for top shareholders within your chosen year. Manual
Updates

0.1.2.5

  • Supports plotting for High frequency data
    • 1 minute average
    • 5 minute average
    • 15 minute average
    • 30 minute average
  • Supports plotting of top shareholders within a year.

0.1.2.4

  • Fixed dependency issues when user has PYQT4 Layer

0.1.2.3

  • Added script to save stock list every 12 hours
  • Increased stability
  • Auto-resize image according to size of the app
  • Added market indexes

Contact:

Email: rzli2@illinois.edu

MIT License Copyright (c) 2017 RongZhou Li Permission is hereby granted, free of charge, to any person obtaining a copy of this software and associated documentation files (the "Software"), to deal in the Software without restriction, including without limitation the rights to use, copy, modify, merge, publish, distribute, sublicense, and/or sell copies of the Software, and to permit persons to whom the Software is furnished to do so, subject to the following conditions: The above copyright notice and this permission notice shall be included in all copies or substantial portions of the Software. THE SOFTWARE IS PROVIDED "AS IS", WITHOUT WARRANTY OF ANY KIND, EXPRESS OR IMPLIED, INCLUDING BUT NOT LIMITED TO THE WARRANTIES OF MERCHANTABILITY, FITNESS FOR A PARTICULAR PURPOSE AND NONINFRINGEMENT. IN NO EVENT SHALL THE AUTHORS OR COPYRIGHT HOLDERS BE LIABLE FOR ANY CLAIM, DAMAGES OR OTHER LIABILITY, WHETHER IN AN ACTION OF CONTRACT, TORT OR OTHERWISE, ARISING FROM, OUT OF OR IN CONNECTION WITH THE SOFTWARE OR THE USE OR OTHER DEALINGS IN THE SOFTWARE.

简介

Tuchart is a visualization interface for the Chinese stock market. Tuchart supports candlestick charts, price charts, tick data, high-frequency data and distribution of top shareholders for individual stocks. Tuchart是一个基于pyqt和echarts的股票视觉化应用。Tuchart 支持日/月线,分笔,高频数据,前十股东分笔的视觉化 展开 收起
MIT
取消

发行版

暂无发行版

贡献者

全部

近期动态

加载更多
不能加载更多了
1
https://gitee.com/lbenw/TuChart.git
git@gitee.com:lbenw/TuChart.git
lbenw
TuChart
TuChart
master

搜索帮助