

代码拉取完成,页面将自动刷新
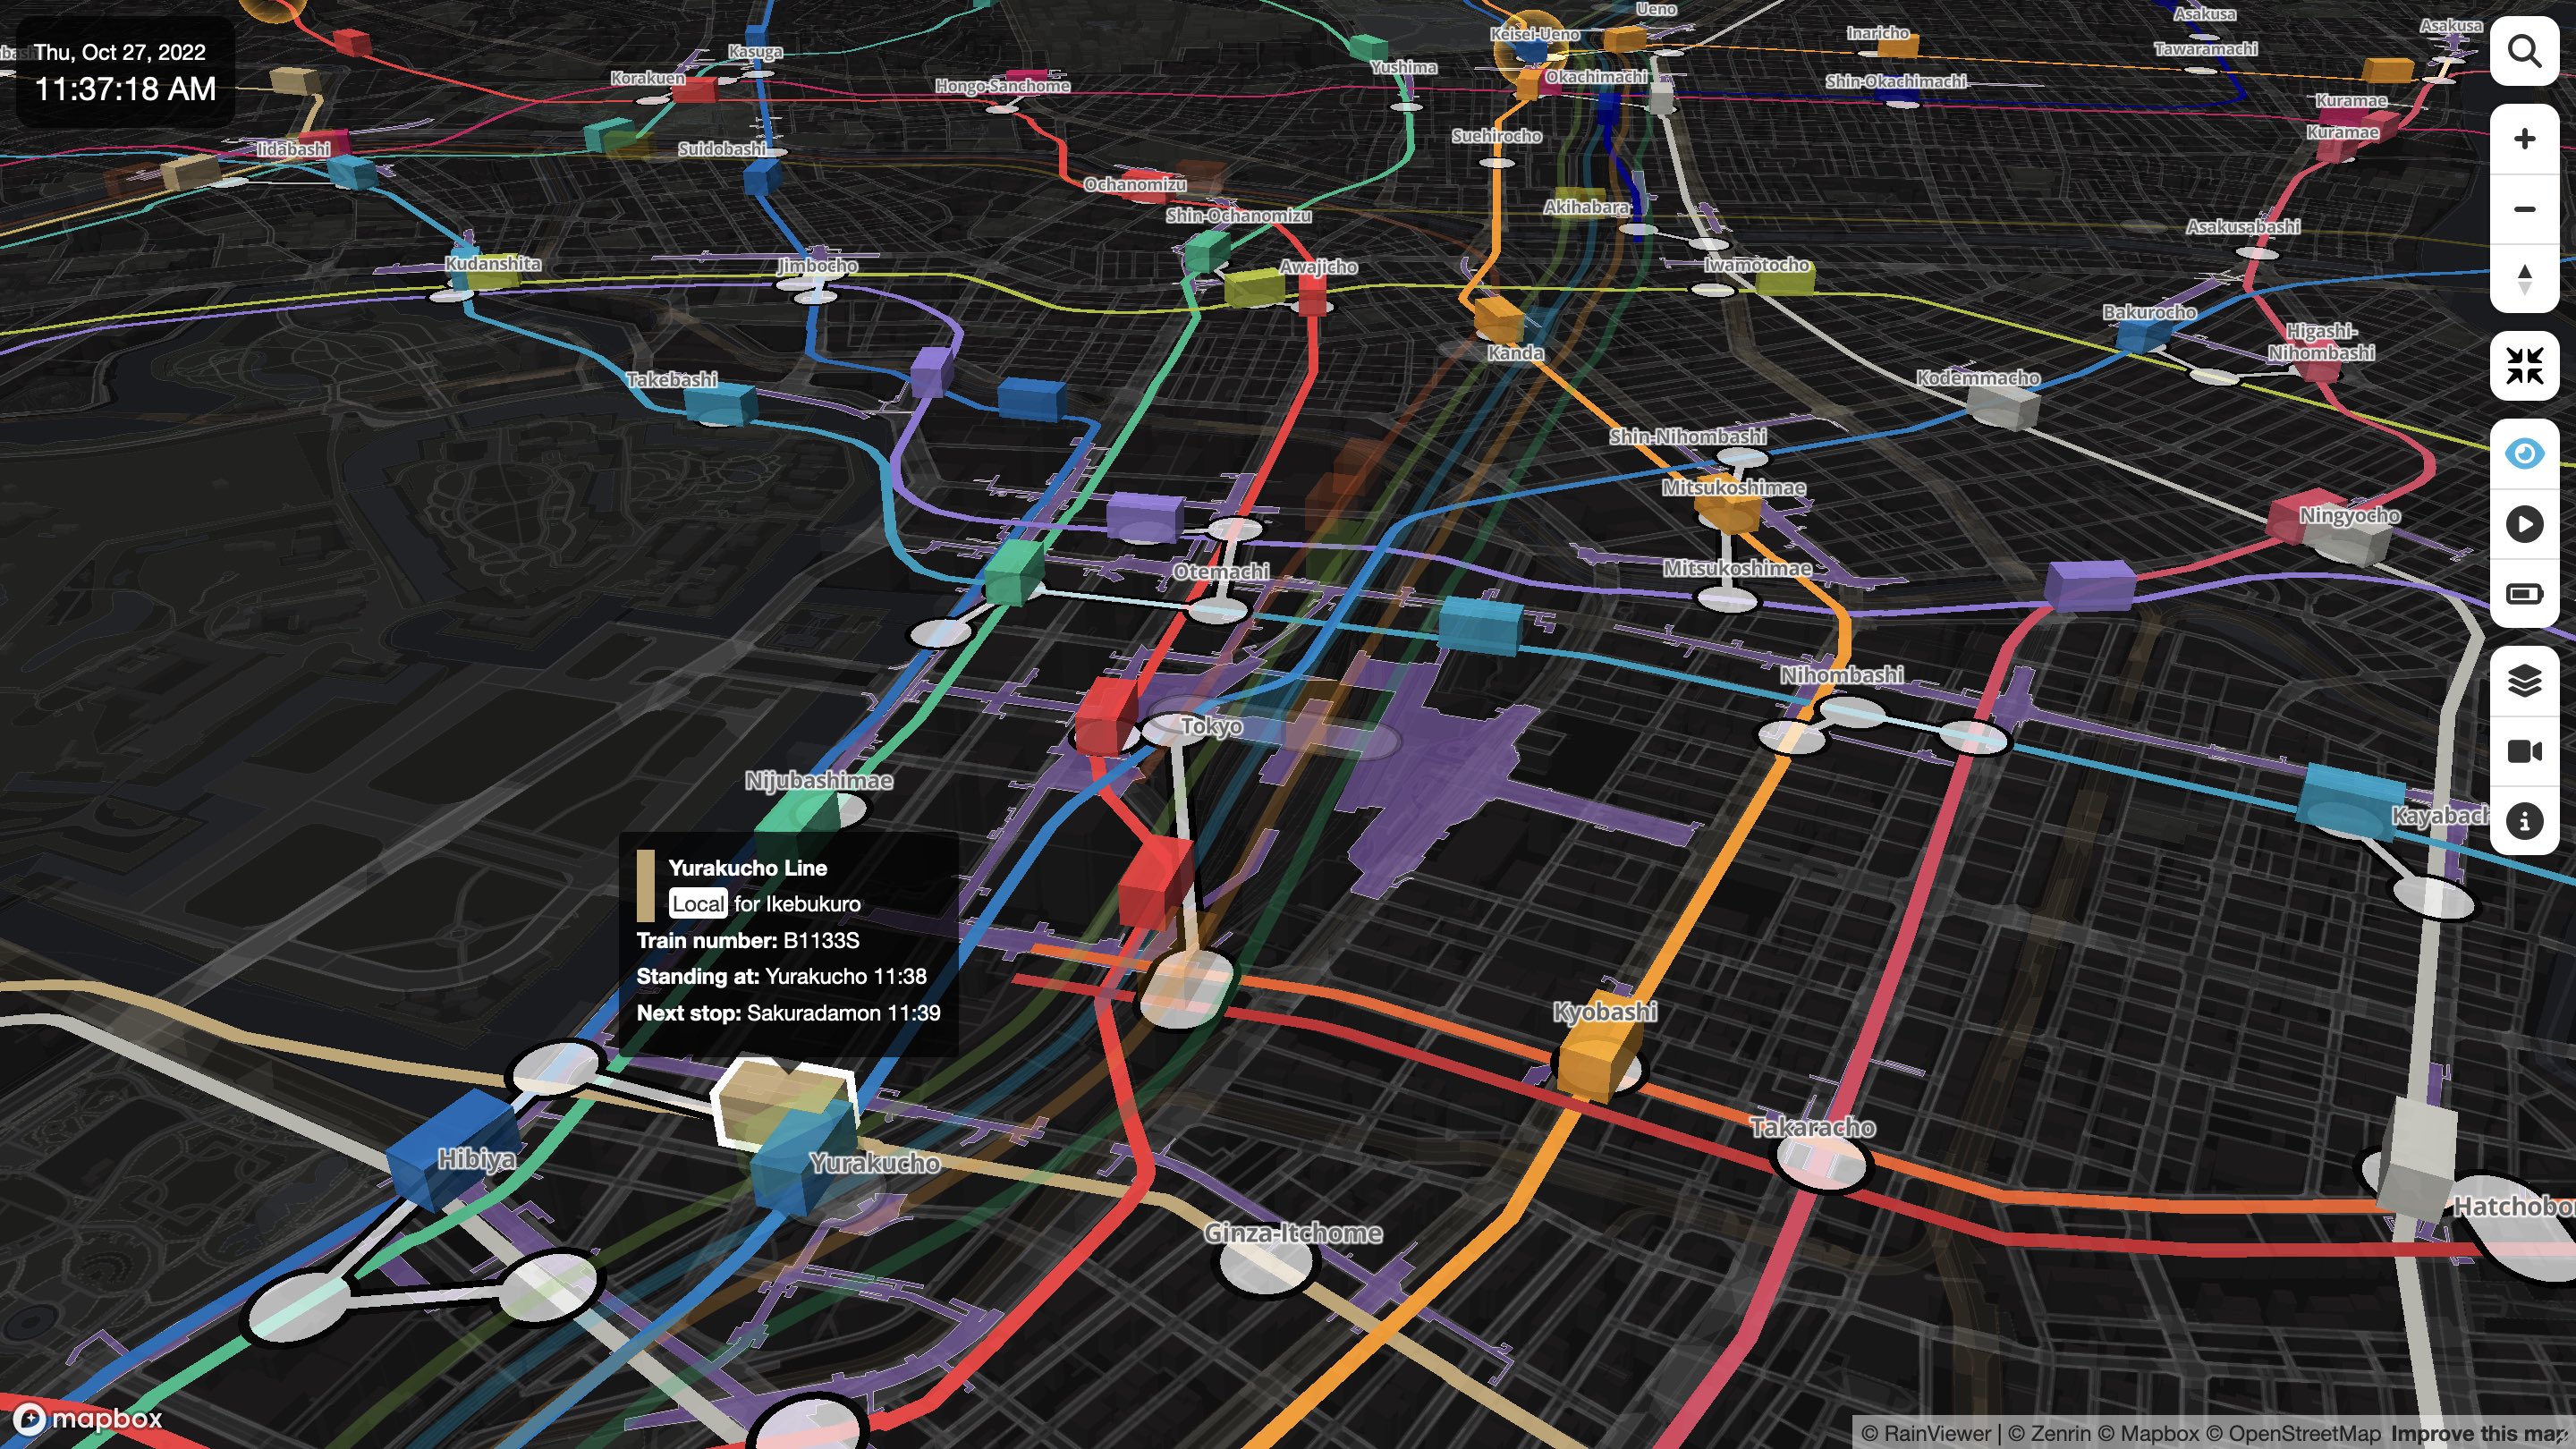
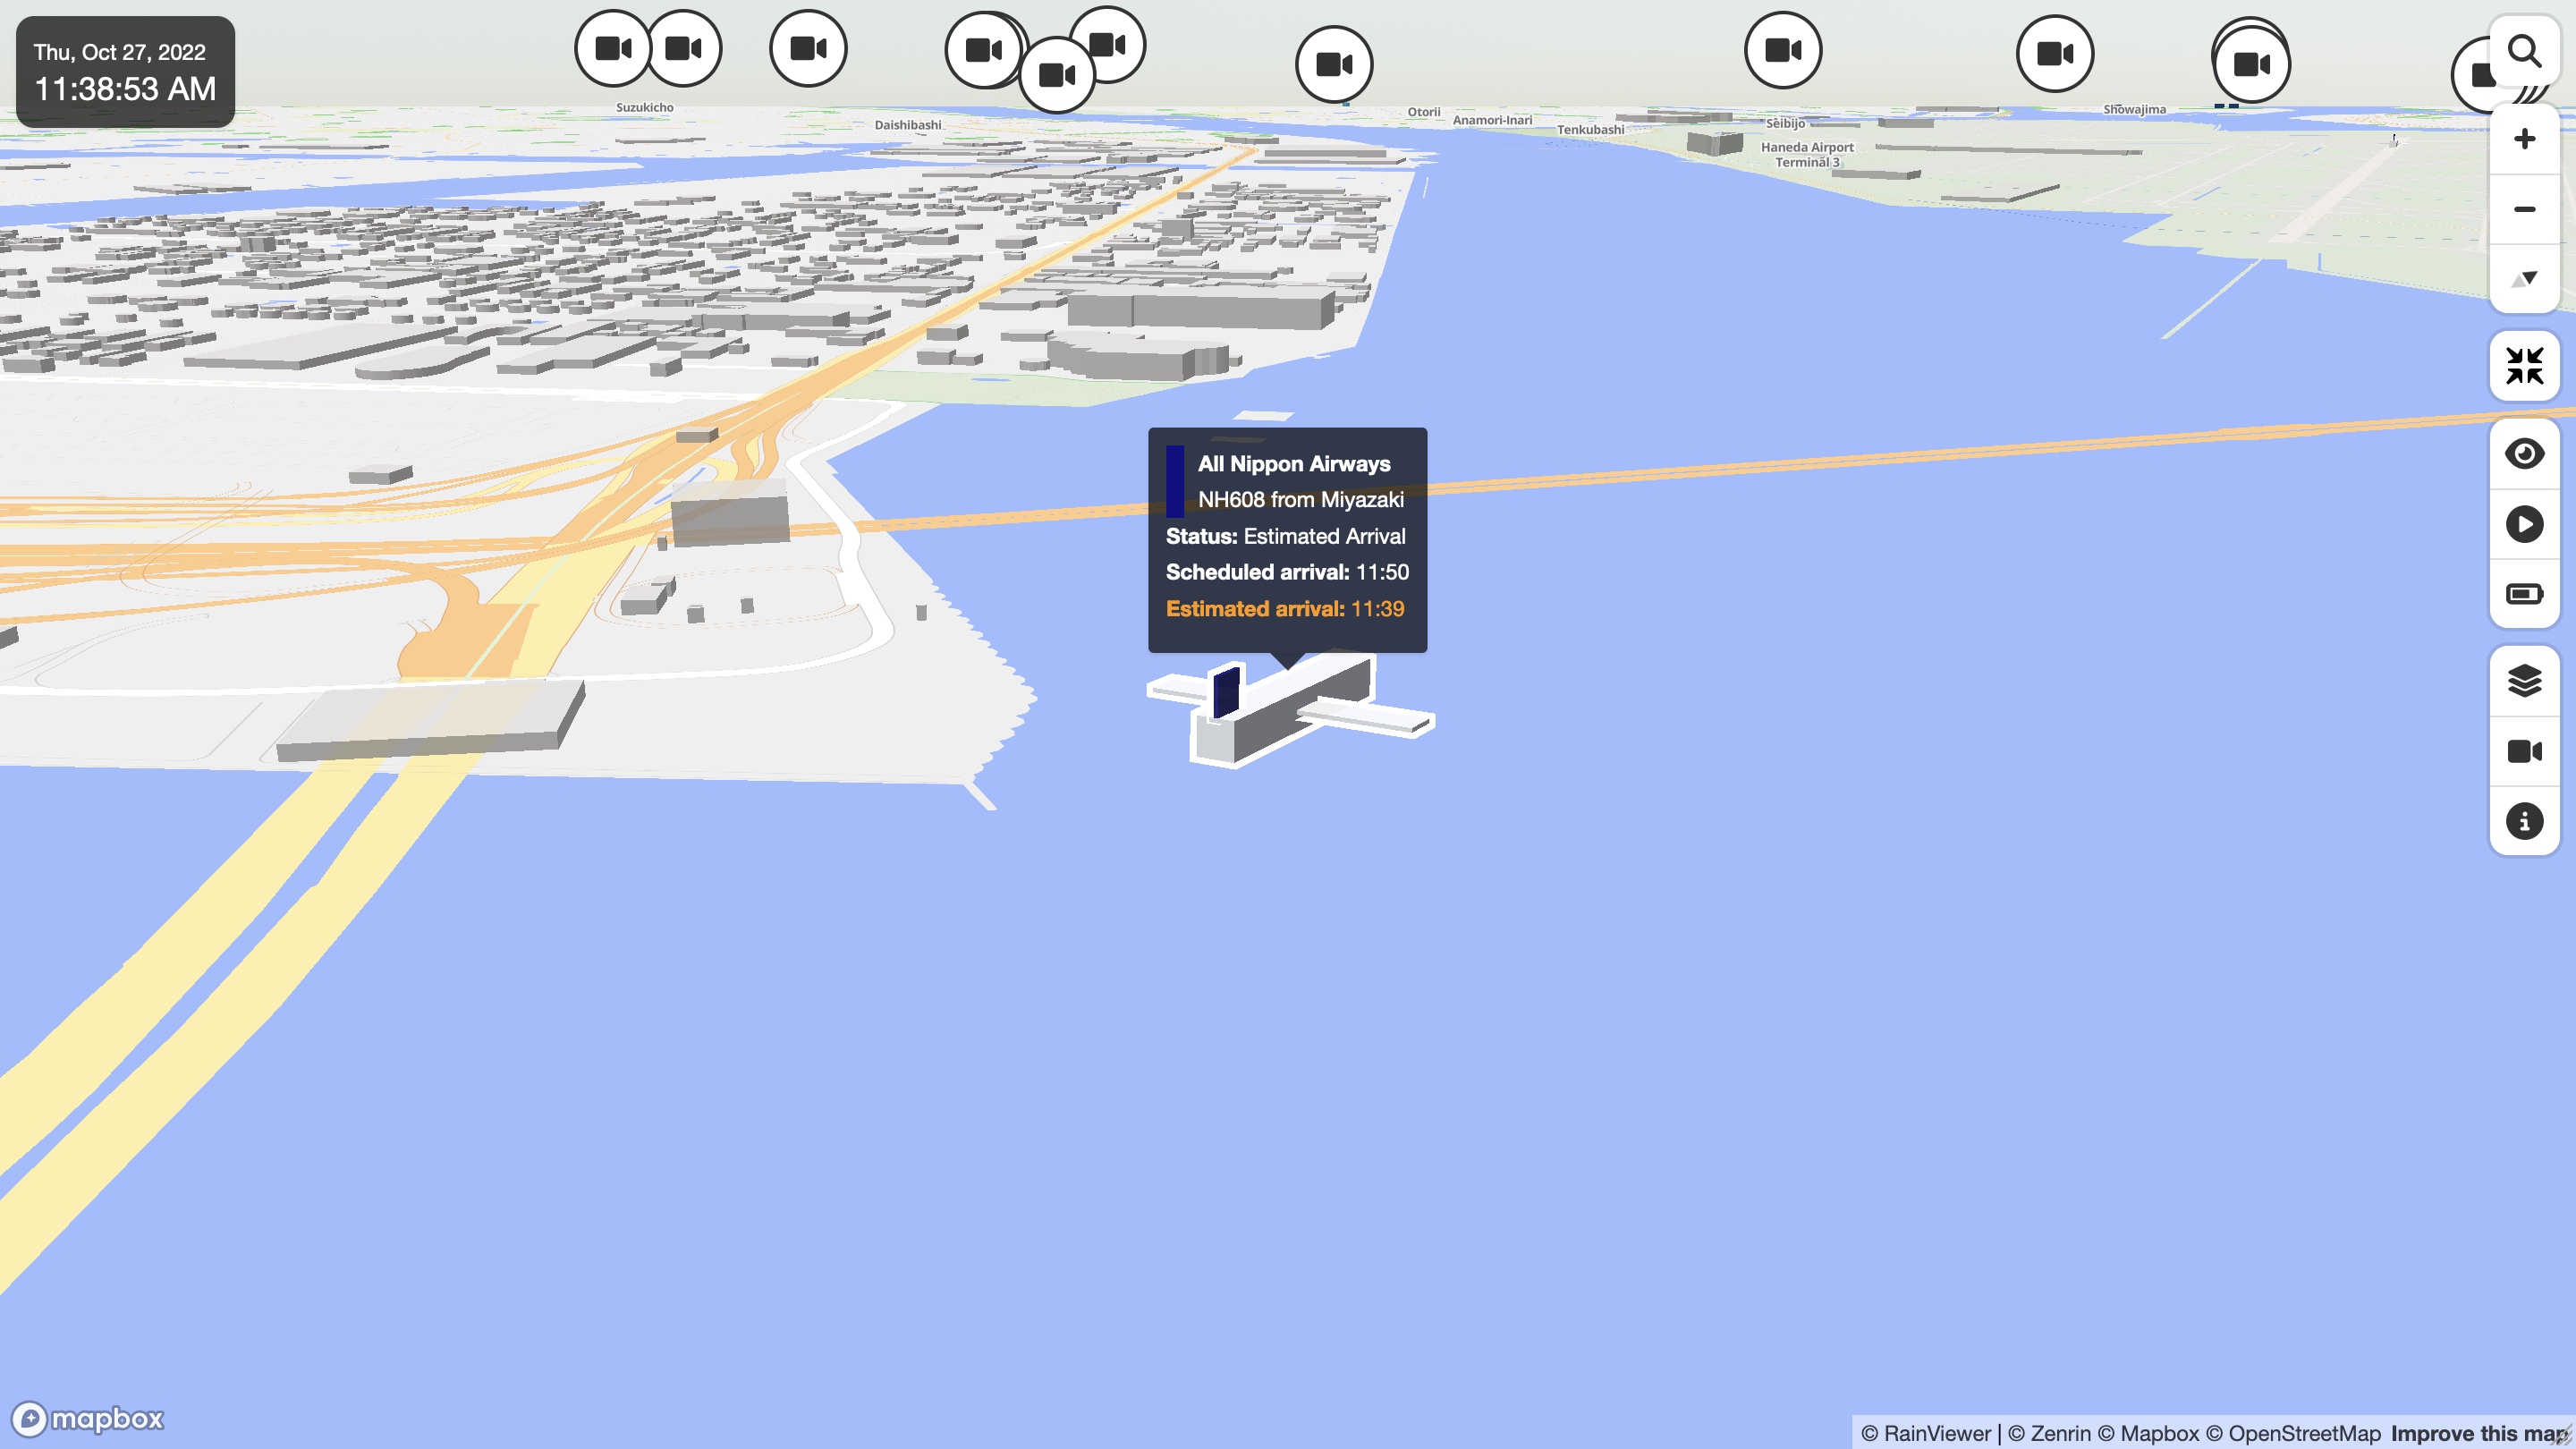
A real-time 3D digital map of Tokyo's public transport system.
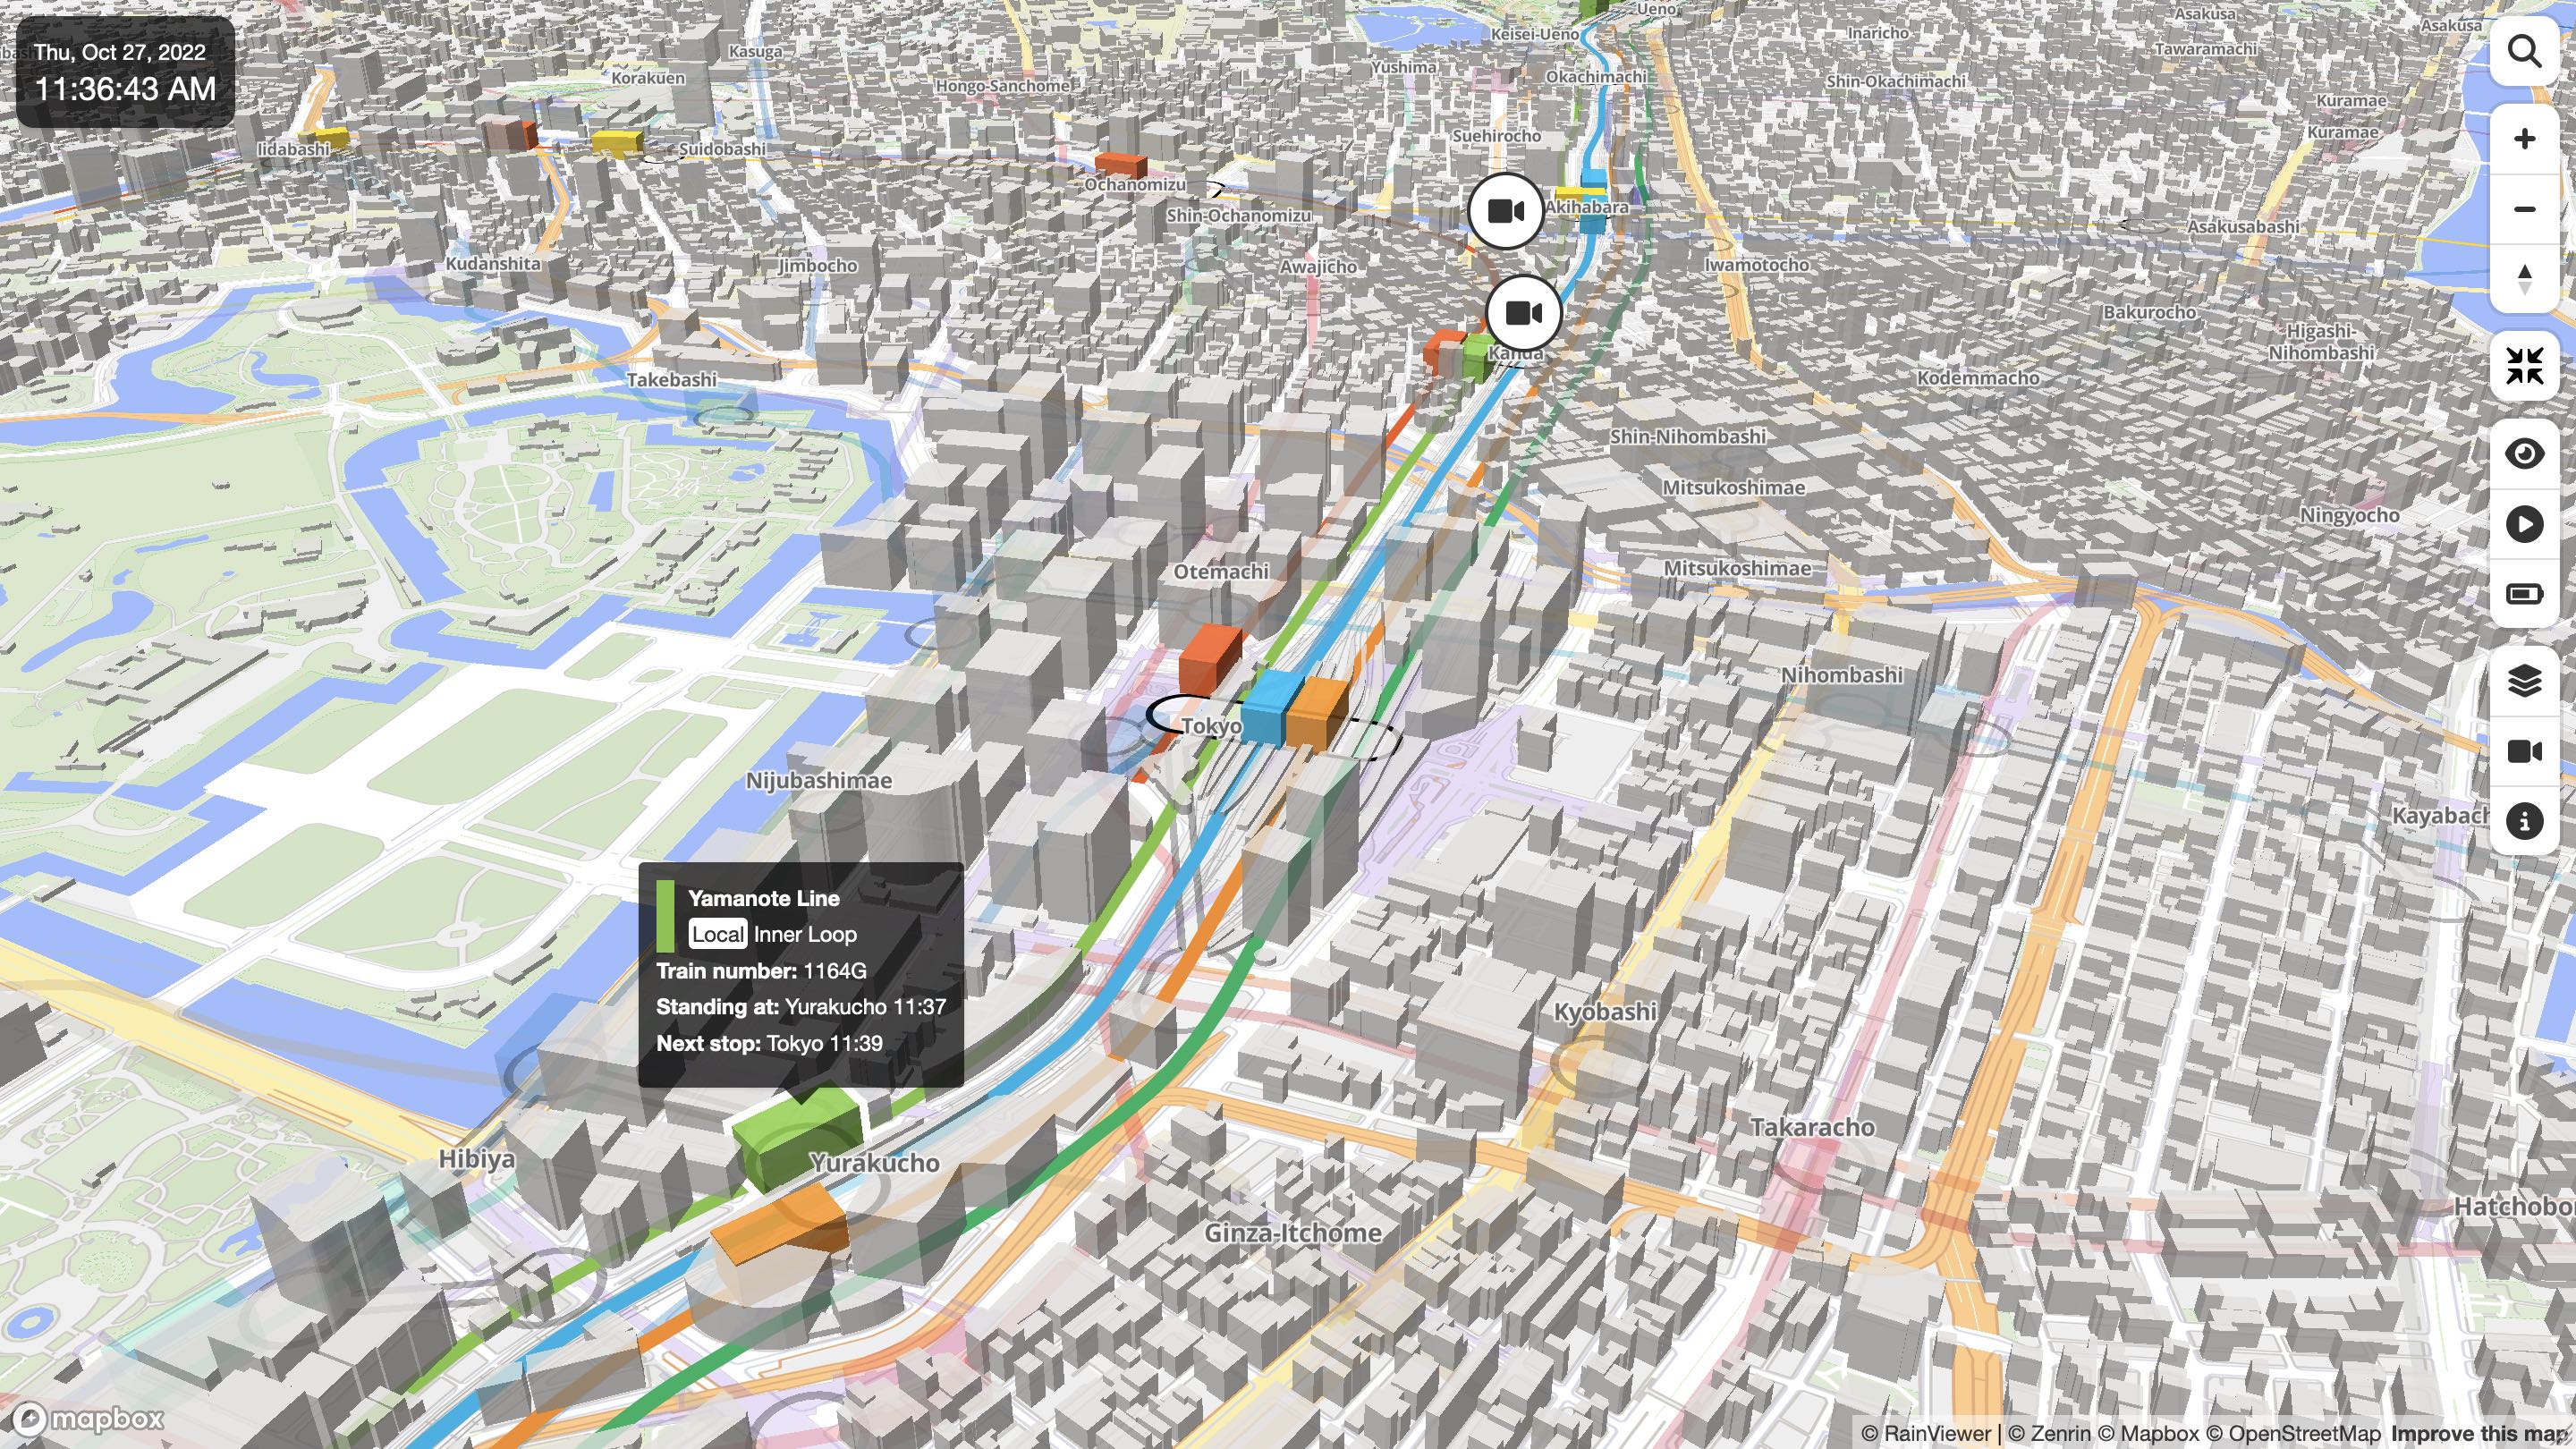
See a Live Demo.
| Operation | Description |
|---|---|
| Mouse or finger drag | Pan |
| Mouse wheel rotation | Zoom in/out |
| Right click or Ctrl key + mouse drag | Tilt up/down and rotate |
| Shift key + mouse drag | Box zoom |
| Pinch in/out | Zoom in/out |
| Two-finger drag | Tilt up/down and rotate |
| Double-click or triple-tap | Zoom in |
| Shift key + Double-click or two-finger tap | Zoom out |
| Click or tap the search button | Show/hide the station search window |
| Click or tap +/- buttons | Zoom in/out |
| Click or tap the compass button | Reset bearing to north |
| Click or tap the compass button + mouse or finder drag | Rotate |
| Click or tap the fullscreen button | Toggle the fullscreen mode |
| Click or tap the eye button | Toggle the underground mode |
| Click or tap the train/helicopter button | Switch the tracking mode |
| Click or tap the playback button | Toggle the playback mode |
| Click or tap the weather button | Show/hide the weather |
| Click or tap the info button | Show/hide the app info dialog |
| Click or tap a train/aircraft | Enable tracking |
| Click or tap the map | Disable tracking |
| Hover a train/aircraft | Show the train/aircraft information |
Currently, the following languages are supported. Any help or contribution with translations and additional language support is always greatly appreciated.
| Language | User Interface | Map Labels | Stations, Railways, Airlines, etc. | User Guide |
|---|---|---|---|---|
| English | Yes | Yes | Yes | Yes |
| Japanese | Yes | Yes | Yes | Yes |
| Chinese (Simplified) | Yes | Yes | Yes | - |
| Chinese (Traditional) | Yes | Yes | Yes | - |
| Korean | Yes | Yes | Yes | - |
| Thai | Yes | - | - | - |
| Nepali | Yes | - | - | - |
If you want to contribute, please start with translating the UI messages in the dictionary-<ISO 639-1 code>.json file in the data directory. Then, if you have extra energy, add the title of each item in your language to airports.json, flight-statuses.json, operators.json, rail-directions.json, railways.json, stations.json, train-types.json in the data directory.
The data for this visualization are sourced from the Open Data Challenge for Public Transportation in Tokyo and the Public Transportation Open Data Center, which includes station information and train timetables as well as real-time data such as train location information and status information of multiple railway lines in the Greater Tokyo area.
First, get access tokens for the public transportation data and map tiles by signing up at Open Data Challenge for Public Transportation in Tokyo, Public Transportation Open Data Center and Mapbox. Then, create a file named secrets which has access tokens in the following format in the root directory of the application.
{
    "tokyochallenge": "xxxxxxxxxxxxxxxxxxxxxxxxxxxxxxxxxxxxxxxxxxxxxxxxxxxxxxxxxxxxxxxx",
    "odpt": "xxxxxxxxxxxxxxxxxxxxxxxxxxxxxxxxxxxxxxxxxxxxxxxxxxxxxxxxxxxxxxxx",
    "mapbox": "pk.xxxxxxxxxxxxxxxxxxxxxxxxxxxxxxxxxxxxxxxxxxxxxxxxxxxxxxxxxxxx.xxxxxxxxxxxxxxxxxxxxxx"
}
The latest version of Node.js is required. Move to the root directory of the application, run the following commands, then the script, dataset and static web page will be generated in the build directory.
npm install
npm run build-all
Mini Tokyo 3D is available under the MIT license.
此处可能存在不合适展示的内容,页面不予展示。您可通过相关编辑功能自查并修改。
如您确认内容无涉及 不当用语 / 纯广告导流 / 暴力 / 低俗色情 / 侵权 / 盗版 / 虚假 / 无价值内容或违法国家有关法律法规的内容,可点击提交进行申诉,我们将尽快为您处理。


